29
/
en
AIzaSyAYiBZKx7MnpbEhh9jyipgxe19OcubqV5w
April 1, 2024
193618
Mauritania
MRT
true
2
1
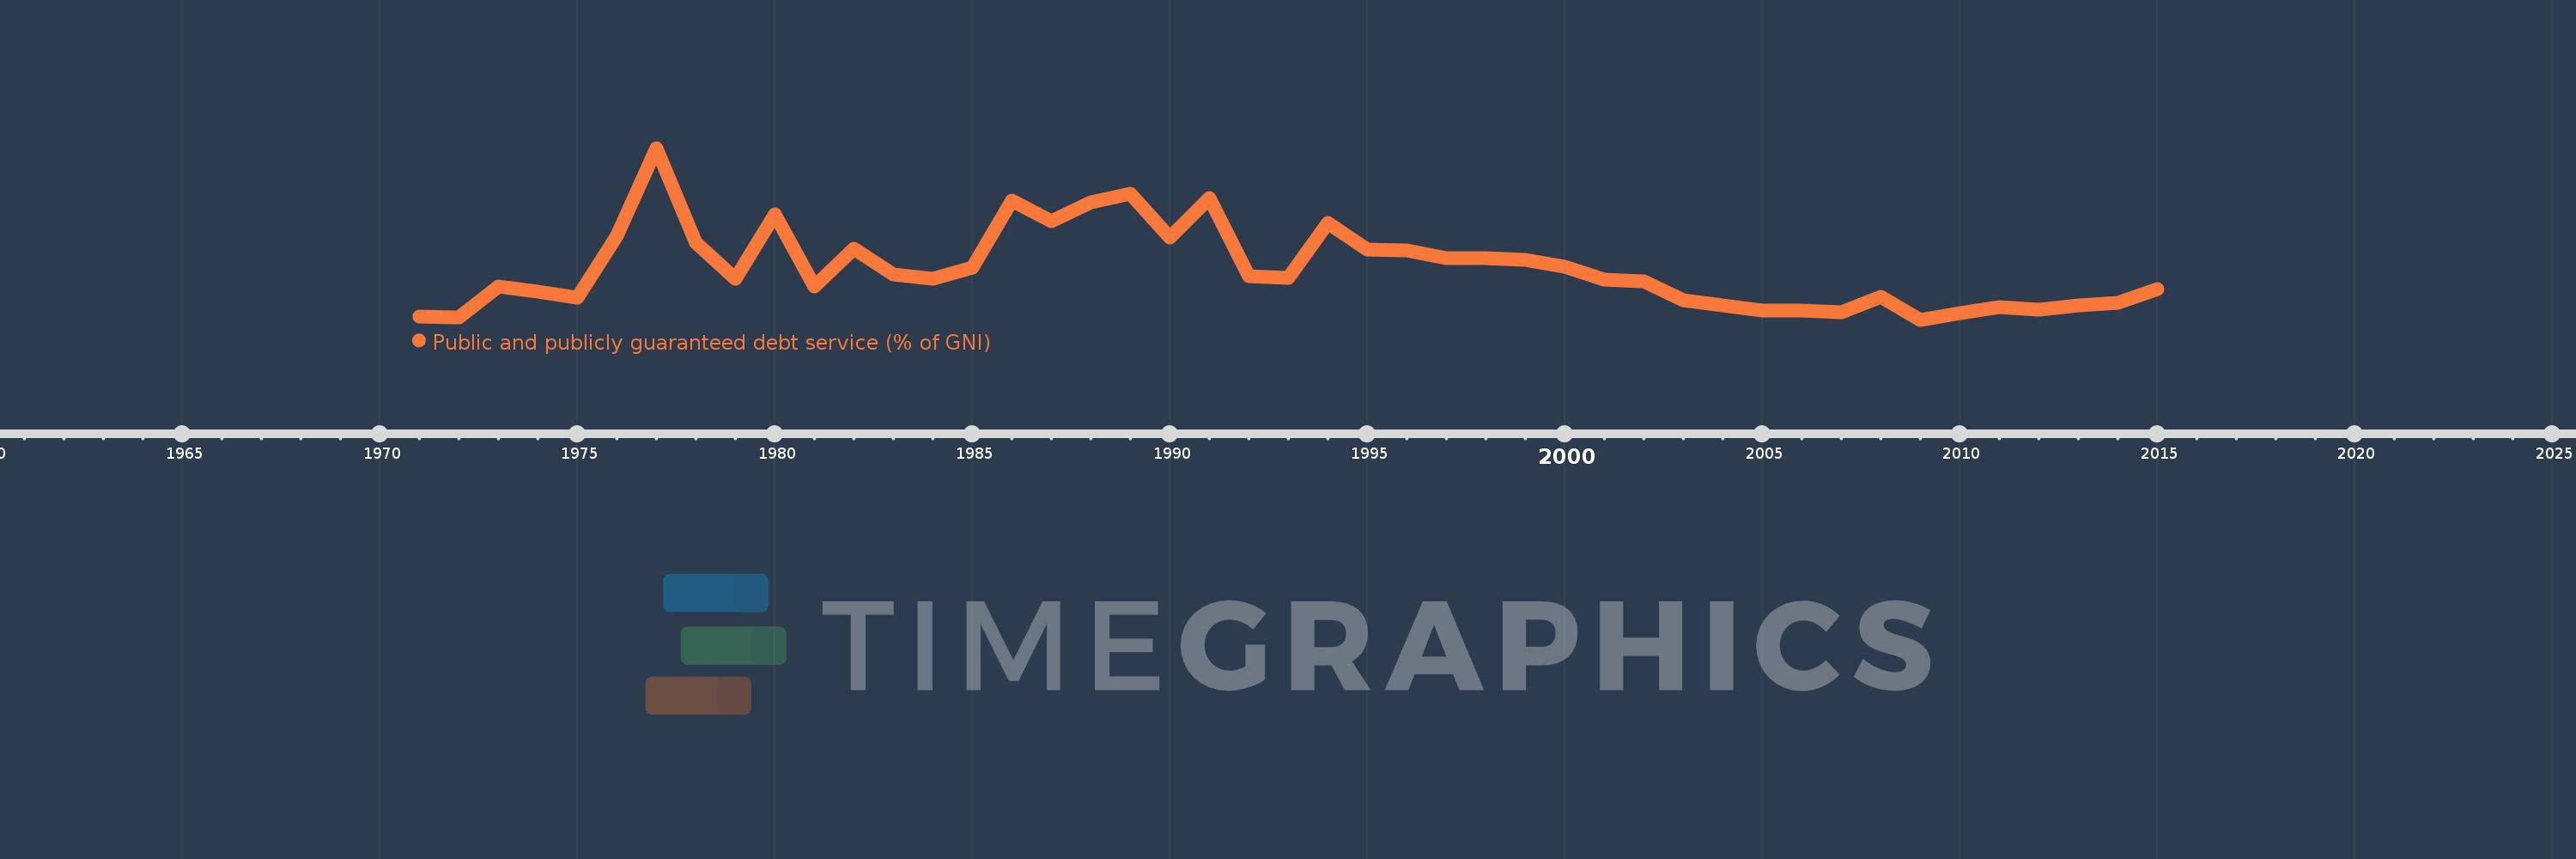
Public and publicly guaranteed debt service (% of GNI)
2015,2014,2013,2012,2011,2010,2009,2008,2007,2006,2005,2004,2003,2002,2001,2000,1999,1998,1997,1996,1995,1994,1993,1992,1991,1990,1989,1988,1987,1986,1985,1984,1983,1982,1981,1980,1979,1978,1977,1976,1975,1974,1973,1972,1971
This statistics in other country:
Timeline:
This timeline shows a graph from 1971 to 2015 of Mauritania. No data until 1970. Number of actual observations by date: 45.
Source name:
World Development Indicators
Source organization:
World Bank, International Debt Statistics.
Categories, topics:
External Debt
Last updated:
apr 23, 2017
Indicators value changes by year
Maximum:
16.617
jan 1, 1977
At the date of observation
Value
Absolute change
Change from previous value
jan 1, 1971
1.78
+1.78
0.0%
jan 1, 1972
1.713
-0.067
-3.76%
jan 1, 1973
4.376
+2.663
155.39%
jan 1, 1974
3.921
-0.455
-10.39%
jan 1, 1975
3.43
-0.492
-12.54%
jan 1, 1976
8.882
+5.452
158.97%
jan 1, 1977
16.617
+7.735
87.09%
jan 1, 1978
8.236
-8.381
-50.44%
jan 1, 1979
5.054
-3.182
-38.64%
jan 1, 1980
10.758
+5.704
112.85%
jan 1, 1981
4.37
-6.388
-59.38%
jan 1, 1982
7.723
+3.353
76.74%
jan 1, 1983
5.435
-2.288
-29.63%
jan 1, 1984
5.078
-0.357
-6.56%
jan 1, 1985
6.077
+0.998
19.66%
jan 1, 1986
11.981
+5.904
97.16%
jan 1, 1987
10.143
-1.838
-15.34%
jan 1, 1988
11.811
+1.668
16.44%
jan 1, 1989
12.584
+0.774
6.55%
jan 1, 1990
8.691
-3.893
-30.94%
jan 1, 1991
12.239
+3.547
40.81%
jan 1, 1992
5.307
-6.931
-56.63%
jan 1, 1993
5.171
-0.136
-2.56%
jan 1, 1994
9.975
+4.803
92.88%
jan 1, 1995
7.692
-2.283
-22.89%
jan 1, 1996
7.61
-0.082
-1.06%
jan 1, 1997
6.939
-0.671
-8.82%
jan 1, 1998
6.871
-0.068
-0.99%
jan 1, 1999
6.716
-0.154
-2.25%
jan 1, 2000
6.147
-0.569
-8.48%
jan 1, 2001
5.027
-1.12
-18.22%
jan 1, 2002
4.862
-0.165
-3.28%
jan 1, 2003
3.175
-1.687
-34.71%
jan 1, 2004
2.725
-0.45
-14.16%
jan 1, 2005
2.309
-0.415
-15.25%
jan 1, 2006
2.319
+0.009
0.41%
jan 1, 2007
2.133
-0.186
-8.02%
jan 1, 2008
3.505
+1.373
64.36%
jan 1, 2009
1.476
-2.03
-57.9%
jan 1, 2010
2.061
+0.586
39.68%
jan 1, 2011
2.601
+0.54
26.19%
jan 1, 2012
2.391
-0.21
-8.08%
jan 1, 2013
2.776
+0.385
16.1%
jan 1, 2014
2.94
+0.164
5.89%
jan 1, 2015
4.153
+1.214
41.29%
Ranking of countries by current statistics by years


Comments: