29
/
en
AIzaSyAYiBZKx7MnpbEhh9jyipgxe19OcubqV5w
April 1, 2024
282931
Vietnam
VNM
true
2
1
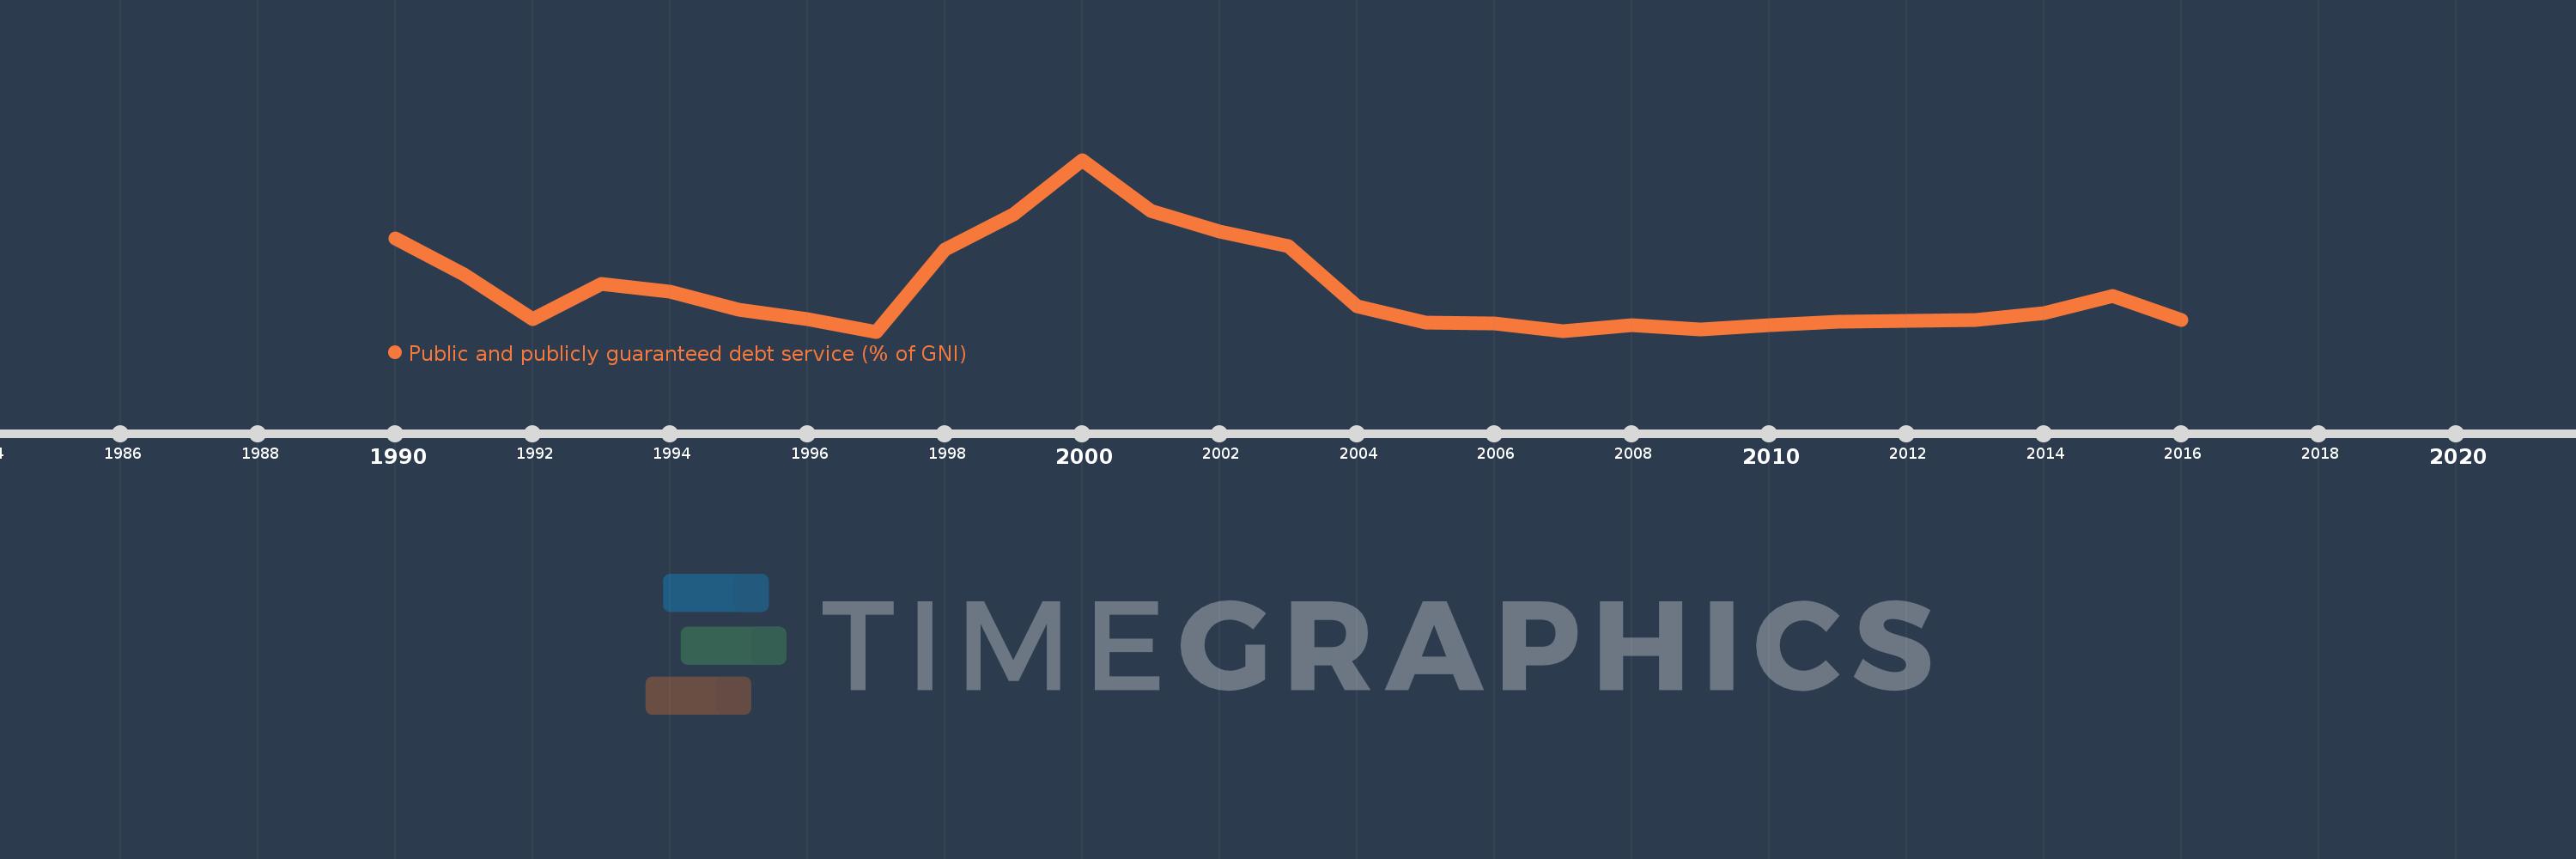
Public and publicly guaranteed debt service (% of GNI)
2016,2015,2014,2013,2012,2011,2010,2009,2008,2007,2006,2005,2004,2003,2002,2001,2000,1999,1998,1997,1996,1995,1994,1993,1992,1991,1990
This statistics in other country:
Timeline:
This timeline shows a graph from 1990 to 2016 of Vietnam. No data until 1989. Number of actual observations by date: 27.
Source name:
World Development Indicators
Source organization:
World Bank, International Debt Statistics.
Categories, topics:
External Debt
Last updated:
apr 23, 2017
Indicators value changes by year
At the date of observation
Value
Absolute change
Change from previous value
jan 1, 1990
3.157
+3.157
0.0%
jan 1, 1991
2.404
-0.753
-23.86%
jan 1, 1992
1.497
-0.907
-37.74%
jan 1, 1993
2.216
+0.719
48.05%
jan 1, 1994
2.053
-0.163
-7.36%
jan 1, 1995
1.686
-0.367
-17.86%
jan 1, 1996
1.493
-0.193
-11.47%
jan 1, 1997
1.238
-0.255
-17.06%
jan 1, 1998
2.932
+1.694
136.83%
jan 1, 1999
3.652
+0.72
24.56%
jan 1, 2000
4.768
+1.116
30.57%
jan 1, 2001
3.718
-1.05
-22.02%
jan 1, 2002
3.286
-0.433
-11.63%
jan 1, 2003
2.996
-0.29
-8.82%
jan 1, 2004
1.767
-1.229
-41.04%
jan 1, 2005
1.421
-0.346
-19.59%
jan 1, 2006
1.412
-0.009
-0.63%
jan 1, 2007
1.241
-0.171
-12.09%
jan 1, 2008
1.378
+0.137
11.02%
jan 1, 2009
1.285
-0.093
-6.74%
jan 1, 2010
1.372
+0.087
6.75%
jan 1, 2011
1.445
+0.073
5.34%
jan 1, 2012
1.457
+0.013
0.87%
jan 1, 2013
1.482
+0.025
1.68%
jan 1, 2014
1.622
+0.141
9.49%
jan 1, 2015
1.972
+0.35
21.55%
jan 1, 2016
1.469
-0.503
-25.5%
Ranking of countries by current statistics by years


Comments: