29
/
en
AIzaSyAYiBZKx7MnpbEhh9jyipgxe19OcubqV5w
April 1, 2024
244159
Solomon Islands
SLB
true
2
1
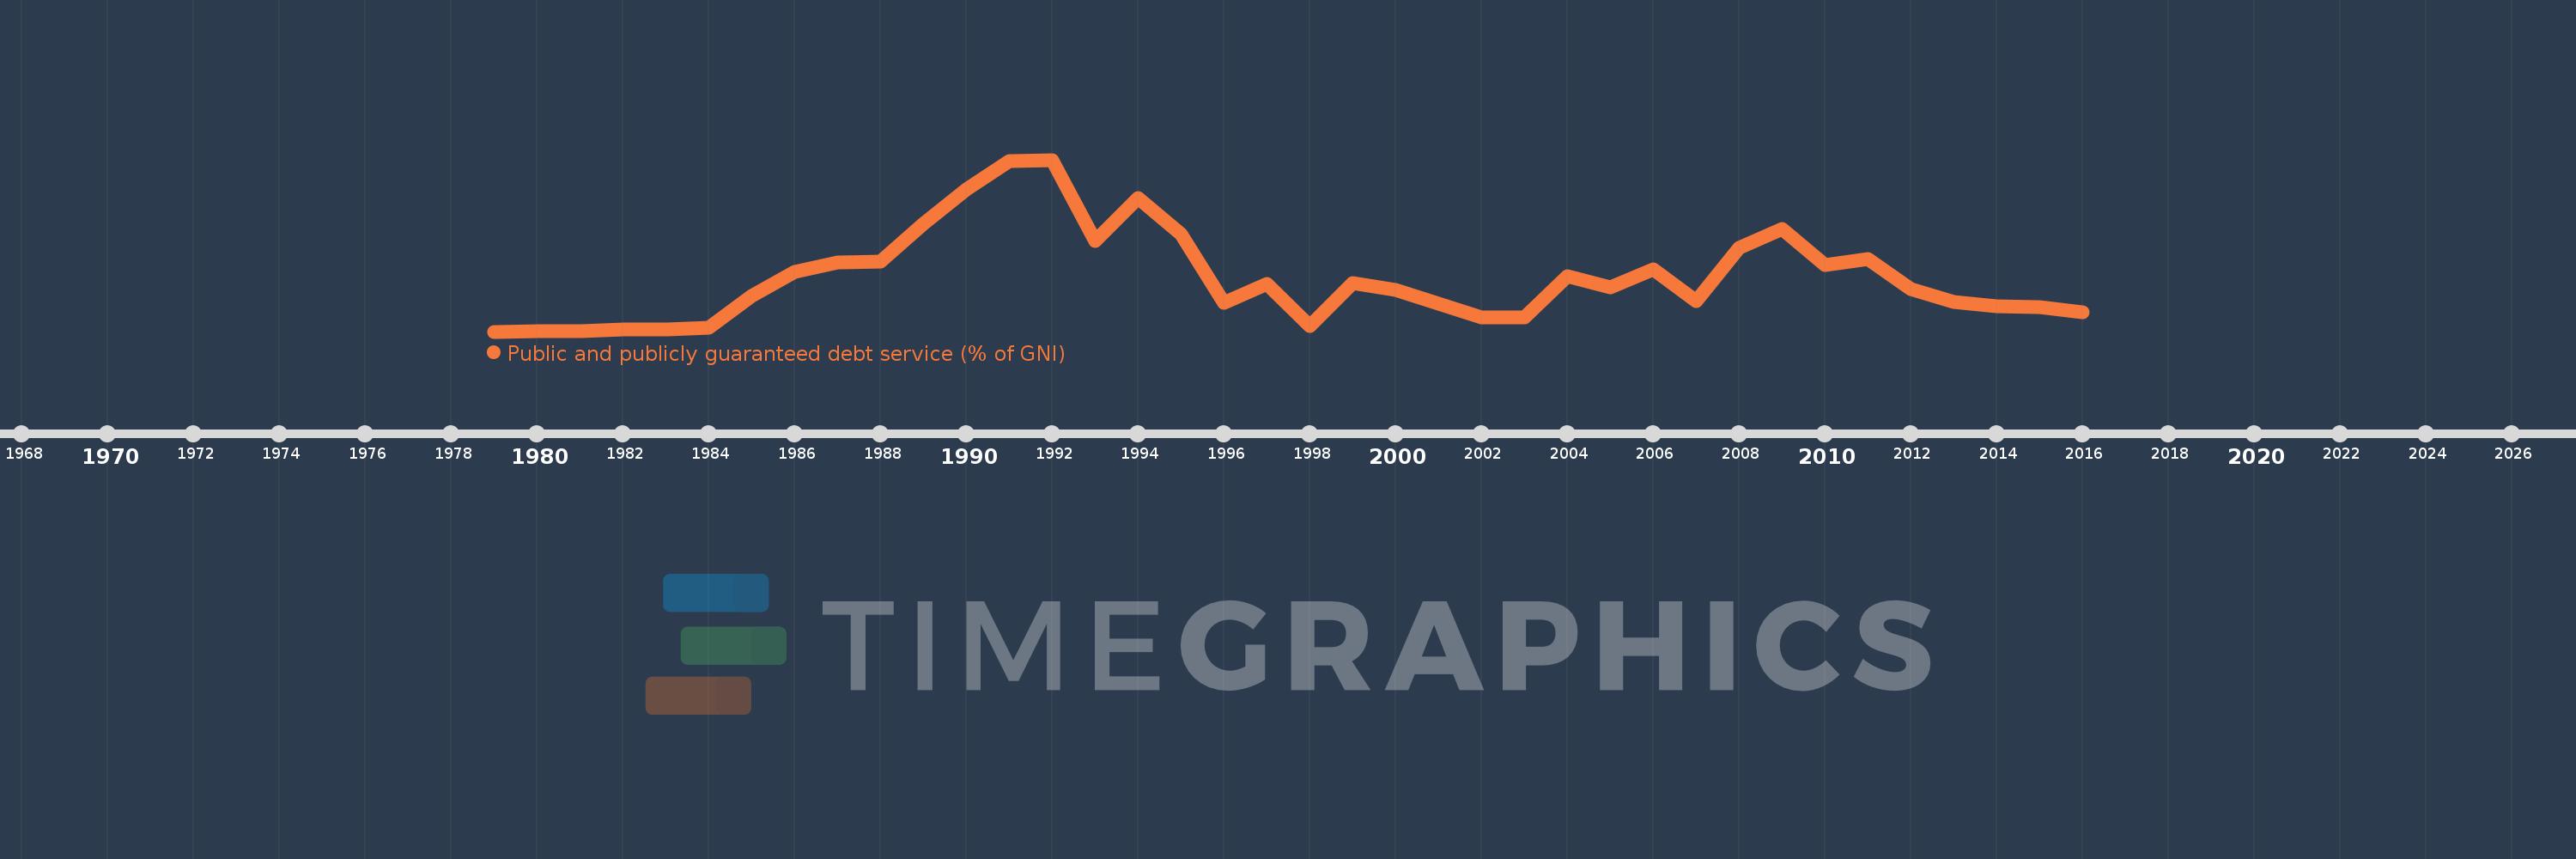
Public and publicly guaranteed debt service (% of GNI)
2016,2015,2014,2013,2012,2011,2010,2009,2008,2007,2006,2005,2004,2003,2002,2001,2000,1999,1998,1997,1996,1995,1994,1993,1992,1991,1990,1989,1988,1987,1986,1985,1984,1983,1982,1981,1980,1979
This statistics in other country:
Timeline:
This timeline shows a graph from 1979 to 2016 of Solomon Islands. No data until 1978. Number of actual observations by date: 38.
Source name:
World Development Indicators
Source organization:
World Bank, International Debt Statistics.
Categories, topics:
External Debt
Last updated:
apr 23, 2017
Indicators value changes by year
At the date of observation
Value
Absolute change
Change from previous value
jan 1, 1979
0.022
+0.022
0.0%
jan 1, 1980
0.025
+0.003
12.12%
jan 1, 1981
0.042
+0.017
69.22%
jan 1, 1982
0.084
+0.042
101.78%
jan 1, 1983
0.076
-0.008
-9.42%
jan 1, 1984
0.13
+0.054
70.29%
jan 1, 1985
1.041
+0.911
701.56%
jan 1, 1986
1.707
+0.666
63.97%
jan 1, 1987
1.986
+0.279
16.34%
jan 1, 1988
1.999
+0.013
0.67%
jan 1, 1989
3.078
+1.079
53.95%
jan 1, 1990
4.073
+0.996
32.35%
jan 1, 1991
4.877
+0.804
19.74%
jan 1, 1992
4.903
+0.026
0.53%
jan 1, 1993
2.599
-2.304
-47.0%
jan 1, 1994
3.819
+1.221
46.97%
jan 1, 1995
2.803
-1.016
-26.6%
jan 1, 1996
0.844
-1.959
-69.88%
jan 1, 1997
1.37
+0.525
62.21%
jan 1, 1998
0.189
-1.181
-86.2%
jan 1, 1999
1.397
+1.208
639.18%
jan 1, 2000
1.203
-0.194
-13.91%
jan 1, 2001
0.82
-0.383
-31.86%
jan 1, 2002
0.434
-0.385
-47.01%
jan 1, 2003
0.43
-0.004
-0.92%
jan 1, 2004
1.605
+1.174
272.92%
jan 1, 2005
1.267
-0.338
-21.07%
jan 1, 2006
1.787
+0.52
41.08%
jan 1, 2007
0.884
-0.903
-50.51%
jan 1, 2008
2.393
+1.509
170.63%
jan 1, 2009
2.937
+0.543
22.7%
jan 1, 2010
1.922
-1.015
-34.56%
jan 1, 2011
2.081
+0.159
8.28%
jan 1, 2012
1.229
-0.852
-40.94%
jan 1, 2013
0.865
-0.364
-29.62%
jan 1, 2014
0.74
-0.125
-14.48%
jan 1, 2015
0.71
-0.03
-4.04%
jan 1, 2016
0.576
-0.134
-18.92%
Ranking of countries by current statistics by years


Comments: