29
/
en
AIzaSyAYiBZKx7MnpbEhh9jyipgxe19OcubqV5w
April 1, 2024
179461
Liberia
LBR
true
2
1
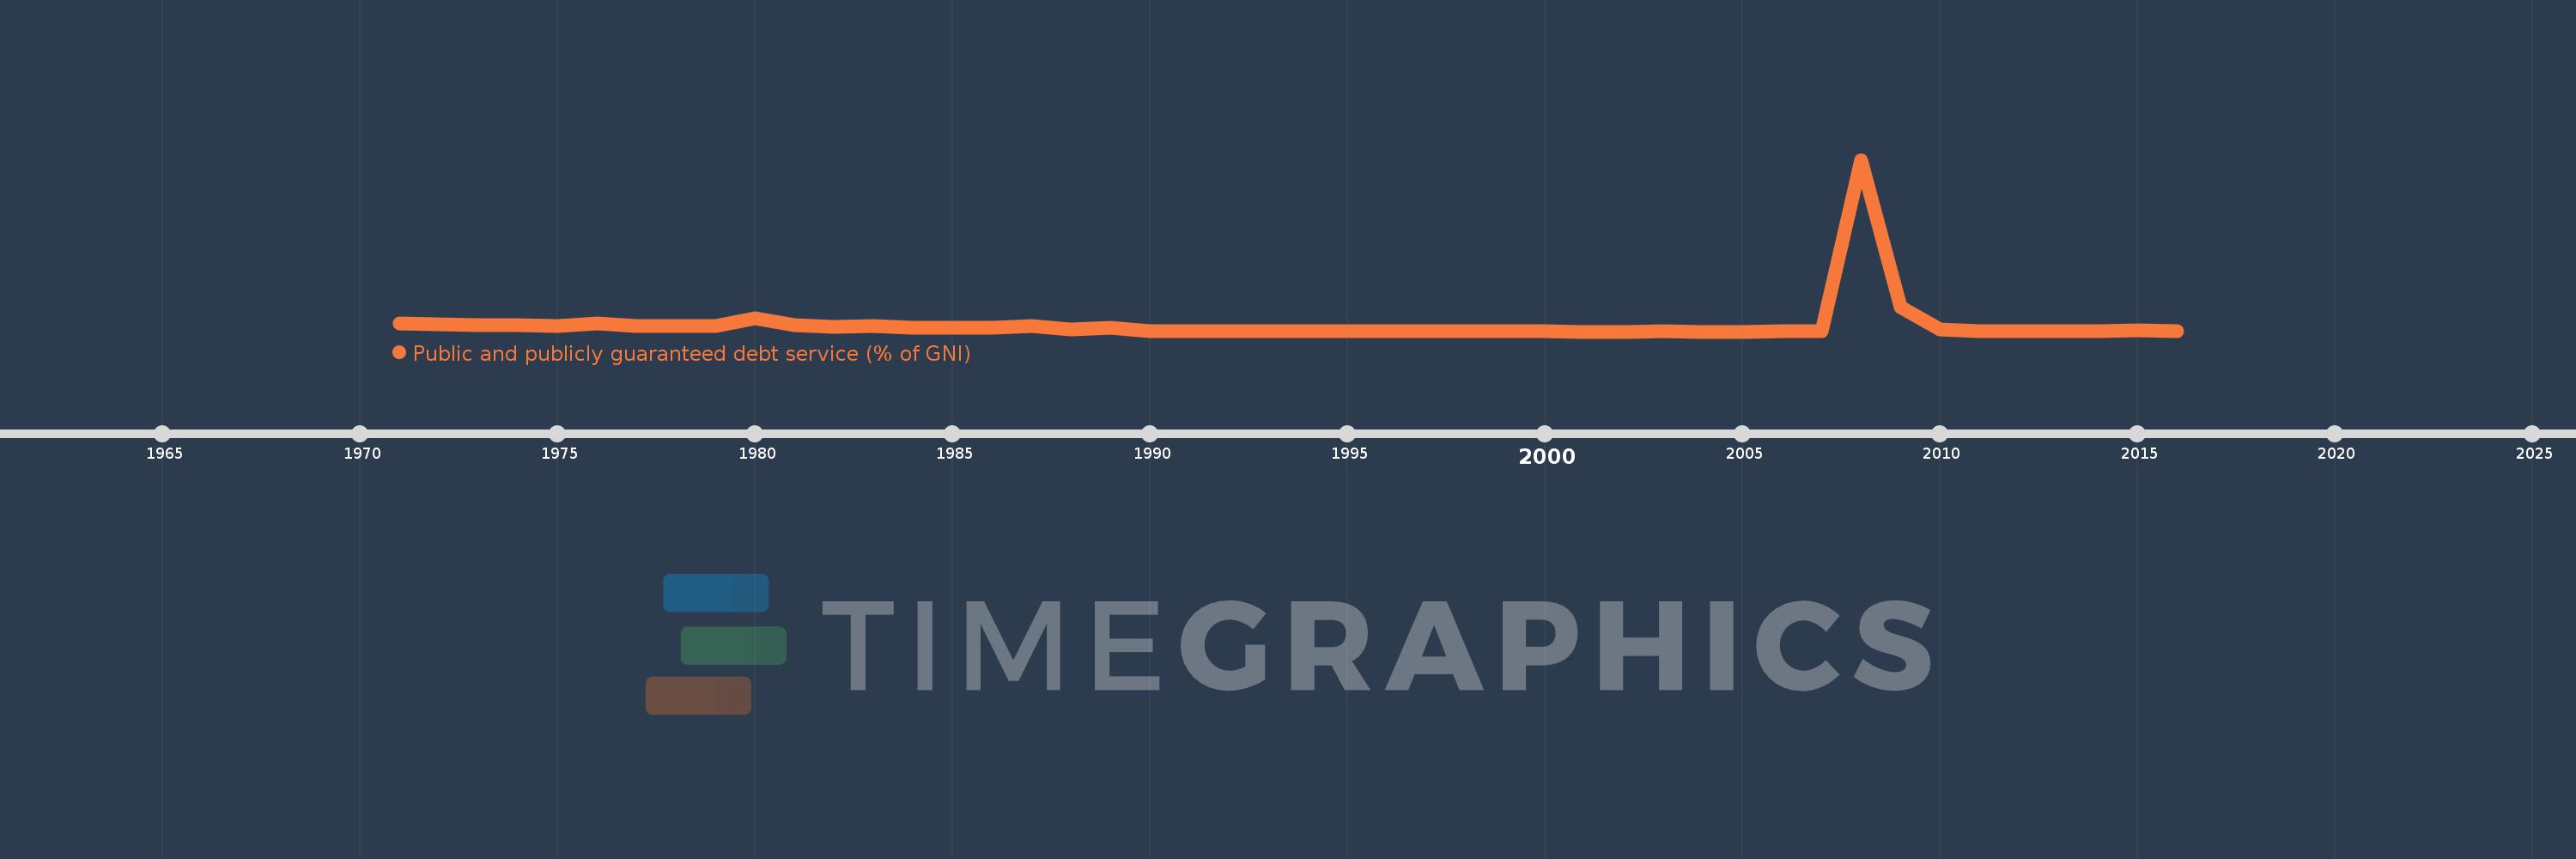
Public and publicly guaranteed debt service (% of GNI)
2016,2015,2014,2013,2012,2011,2010,2009,2008,2007,2006,2005,2004,2003,2002,2001,2000,1999,1998,1990,1989,1988,1987,1986,1985,1984,1983,1982,1981,1980,1979,1978,1977,1976,1975,1974,1973,1972,1971
This statistics in other country:
Timeline:
This timeline shows a graph from 1971 to 2016 of Liberia. No data until 1970. Number of actual observations by date: 39.
Source name:
World Development Indicators
Source organization:
World Bank, International Debt Statistics.
Categories, topics:
External Debt
Last updated:
apr 23, 2017
Indicators value changes by year
Maximum:
109.649
jan 1, 2008
At the date of observation
Value
Absolute change
Change from previous value
jan 1, 1971
5.105
+5.105
0.0%
jan 1, 1972
4.631
-0.475
-9.3%
jan 1, 1973
4.27
-0.36
-7.78%
jan 1, 1974
4.139
-0.131
-3.07%
jan 1, 1975
3.739
-0.4
-9.67%
jan 1, 1976
5.275
+1.536
41.09%
jan 1, 1977
3.311
-1.964
-37.24%
jan 1, 1978
3.554
+0.243
7.34%
jan 1, 1979
3.294
-0.26
-7.31%
jan 1, 1980
8.32
+5.026
152.55%
jan 1, 1981
4.082
-4.238
-50.94%
jan 1, 1982
2.788
-1.294
-31.69%
jan 1, 1983
3.725
+0.937
33.59%
jan 1, 1984
2.577
-1.148
-30.82%
jan 1, 1985
2.409
-0.168
-6.53%
jan 1, 1986
2.299
-0.109
-4.53%
jan 1, 1987
3.804
+1.504
65.42%
jan 1, 1988
1.572
-2.232
-58.68%
jan 1, 1989
2.266
+0.694
44.15%
jan 1, 1990
0.498
-1.768
-78.02%
jan 1, 1998
0.019
-0.479
-96.25%
jan 1, 1999
0.012
-0.007
-36.51%
jan 1, 2000
0.008
-0.004
-31.82%
jan 1, 2001
0.0
-0.008
-100.0%
jan 1, 2003
0.005
+0.005
%
jan 1, 2004
0.0
-0.005
-100.0%
jan 1, 2006
0.008
+0.008
%
jan 1, 2007
0.011
+0.003
30.88%
jan 1, 2008
109.649
+109.639
1.03 mln%
jan 1, 2009
15.424
-94.225
-85.93%
jan 1, 2010
1.593
-13.831
-89.67%
jan 1, 2011
0.389
-1.203
-75.55%
jan 1, 2012
0.211
-0.178
-45.83%
jan 1, 2013
0.309
+0.098
46.36%
jan 1, 2014
0.376
+0.067
21.67%
jan 1, 2015
0.844
+0.469
124.78%
jan 1, 2016
0.275
-0.57
-67.47%
Ranking of countries by current statistics by years


Comments: