29
/
en
AIzaSyAYiBZKx7MnpbEhh9jyipgxe19OcubqV5w
April 1, 2024
141048
Ghana
GHA
true
2
1
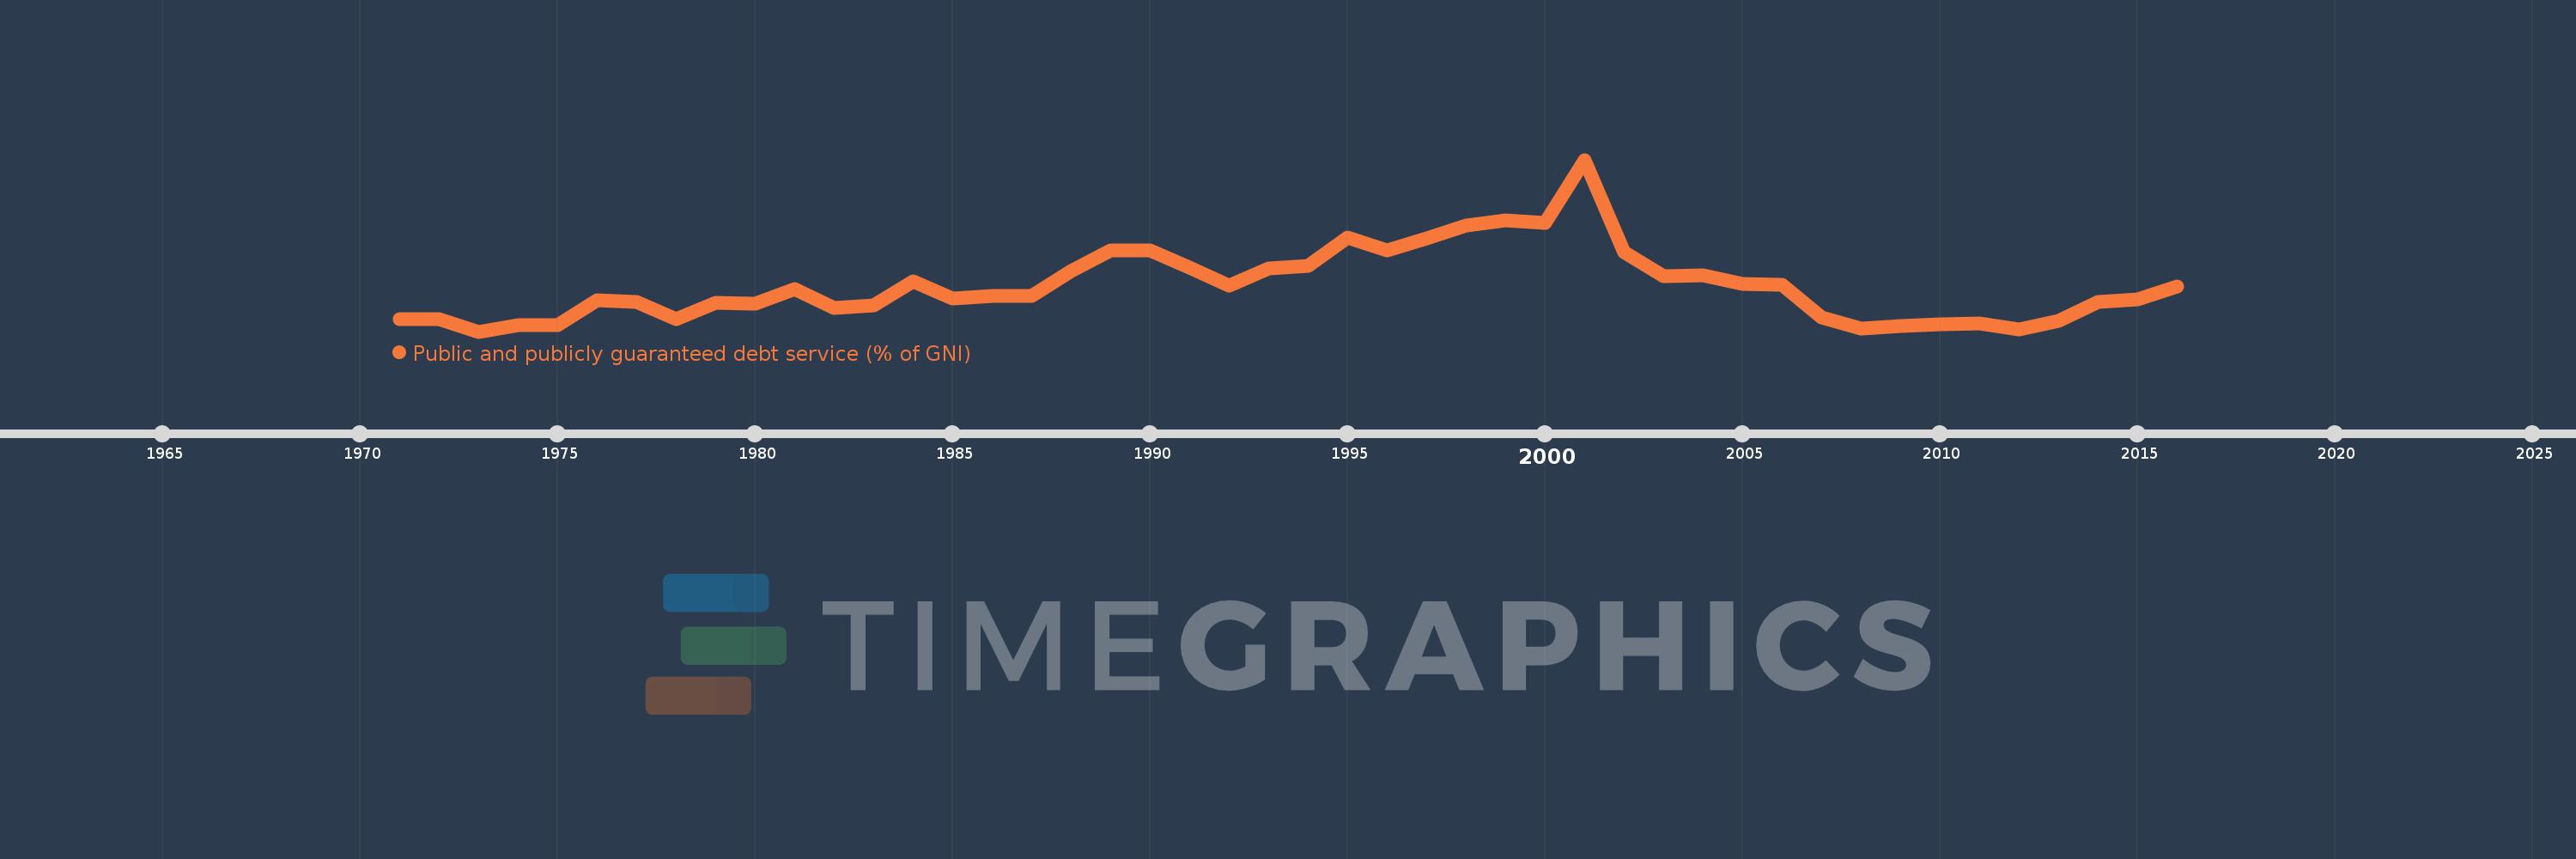
Public and publicly guaranteed debt service (% of GNI)
2016,2015,2014,2013,2012,2011,2010,2009,2008,2007,2006,2005,2004,2003,2002,2001,2000,1999,1998,1997,1996,1995,1994,1993,1992,1991,1990,1989,1988,1987,1986,1985,1984,1983,1982,1981,1980,1979,1978,1977,1976,1975,1974,1973,1972,1971
This statistics in other country:
Timeline:
This timeline shows a graph from 1971 to 2016 of Ghana. No data until 1970. Number of actual observations by date: 46.
Source name:
World Development Indicators
Source organization:
World Bank, International Debt Statistics.
Categories, topics:
External Debt
Last updated:
apr 23, 2017
Indicators value changes by year
At the date of observation
Value
Absolute change
Change from previous value
jan 1, 1971
1.208
+1.208
0.0%
jan 1, 1972
1.2
-0.008
-0.7%
jan 1, 1973
0.691
-0.509
-42.42%
jan 1, 1974
0.948
+0.257
37.26%
jan 1, 1975
0.948
-0.001
-0.06%
jan 1, 1976
1.967
+1.019
107.57%
jan 1, 1977
1.892
-0.075
-3.81%
jan 1, 1978
1.193
-0.699
-36.95%
jan 1, 1979
1.858
+0.666
55.8%
jan 1, 1980
1.844
-0.015
-0.79%
jan 1, 1981
2.433
+0.59
31.98%
jan 1, 1982
1.645
-0.788
-32.4%
jan 1, 1983
1.769
+0.124
7.56%
jan 1, 1984
2.753
+0.983
55.59%
jan 1, 1985
2.038
-0.715
-25.97%
jan 1, 1986
2.153
+0.115
5.63%
jan 1, 1987
2.148
-0.004
-0.19%
jan 1, 1988
3.165
+1.017
47.33%
jan 1, 1989
4.019
+0.853
26.96%
jan 1, 1990
4.032
+0.013
0.33%
jan 1, 1991
3.33
-0.702
-17.41%
jan 1, 1992
2.58
-0.75
-22.52%
jan 1, 1993
3.284
+0.704
27.28%
jan 1, 1994
3.385
+0.101
3.08%
jan 1, 1995
4.554
+1.168
34.51%
jan 1, 1996
4.009
-0.545
-11.97%
jan 1, 1997
4.511
+0.502
12.53%
jan 1, 1998
5.035
+0.524
11.61%
jan 1, 1999
5.243
+0.208
4.14%
jan 1, 2000
5.166
-0.077
-1.48%
jan 1, 2001
7.741
+2.575
49.85%
jan 1, 2002
3.942
-3.799
-49.08%
jan 1, 2003
2.975
-0.967
-24.54%
jan 1, 2004
2.995
+0.02
0.68%
jan 1, 2005
2.648
-0.347
-11.59%
jan 1, 2006
2.615
-0.033
-1.23%
jan 1, 2007
1.261
-1.354
-51.77%
jan 1, 2008
0.813
-0.448
-35.52%
jan 1, 2009
0.937
+0.124
15.25%
jan 1, 2010
0.975
+0.037
3.99%
jan 1, 2011
1.029
+0.054
5.53%
jan 1, 2012
0.795
-0.234
-22.73%
jan 1, 2013
1.136
+0.341
42.87%
jan 1, 2014
1.924
+0.789
69.45%
jan 1, 2015
2.011
+0.087
4.51%
jan 1, 2016
2.545
+0.534
26.54%
Ranking of countries by current statistics by years


Comments: