29
/
en
AIzaSyAYiBZKx7MnpbEhh9jyipgxe19OcubqV5w
April 1, 2024
38534
IDA blend
IDB
false
2
1
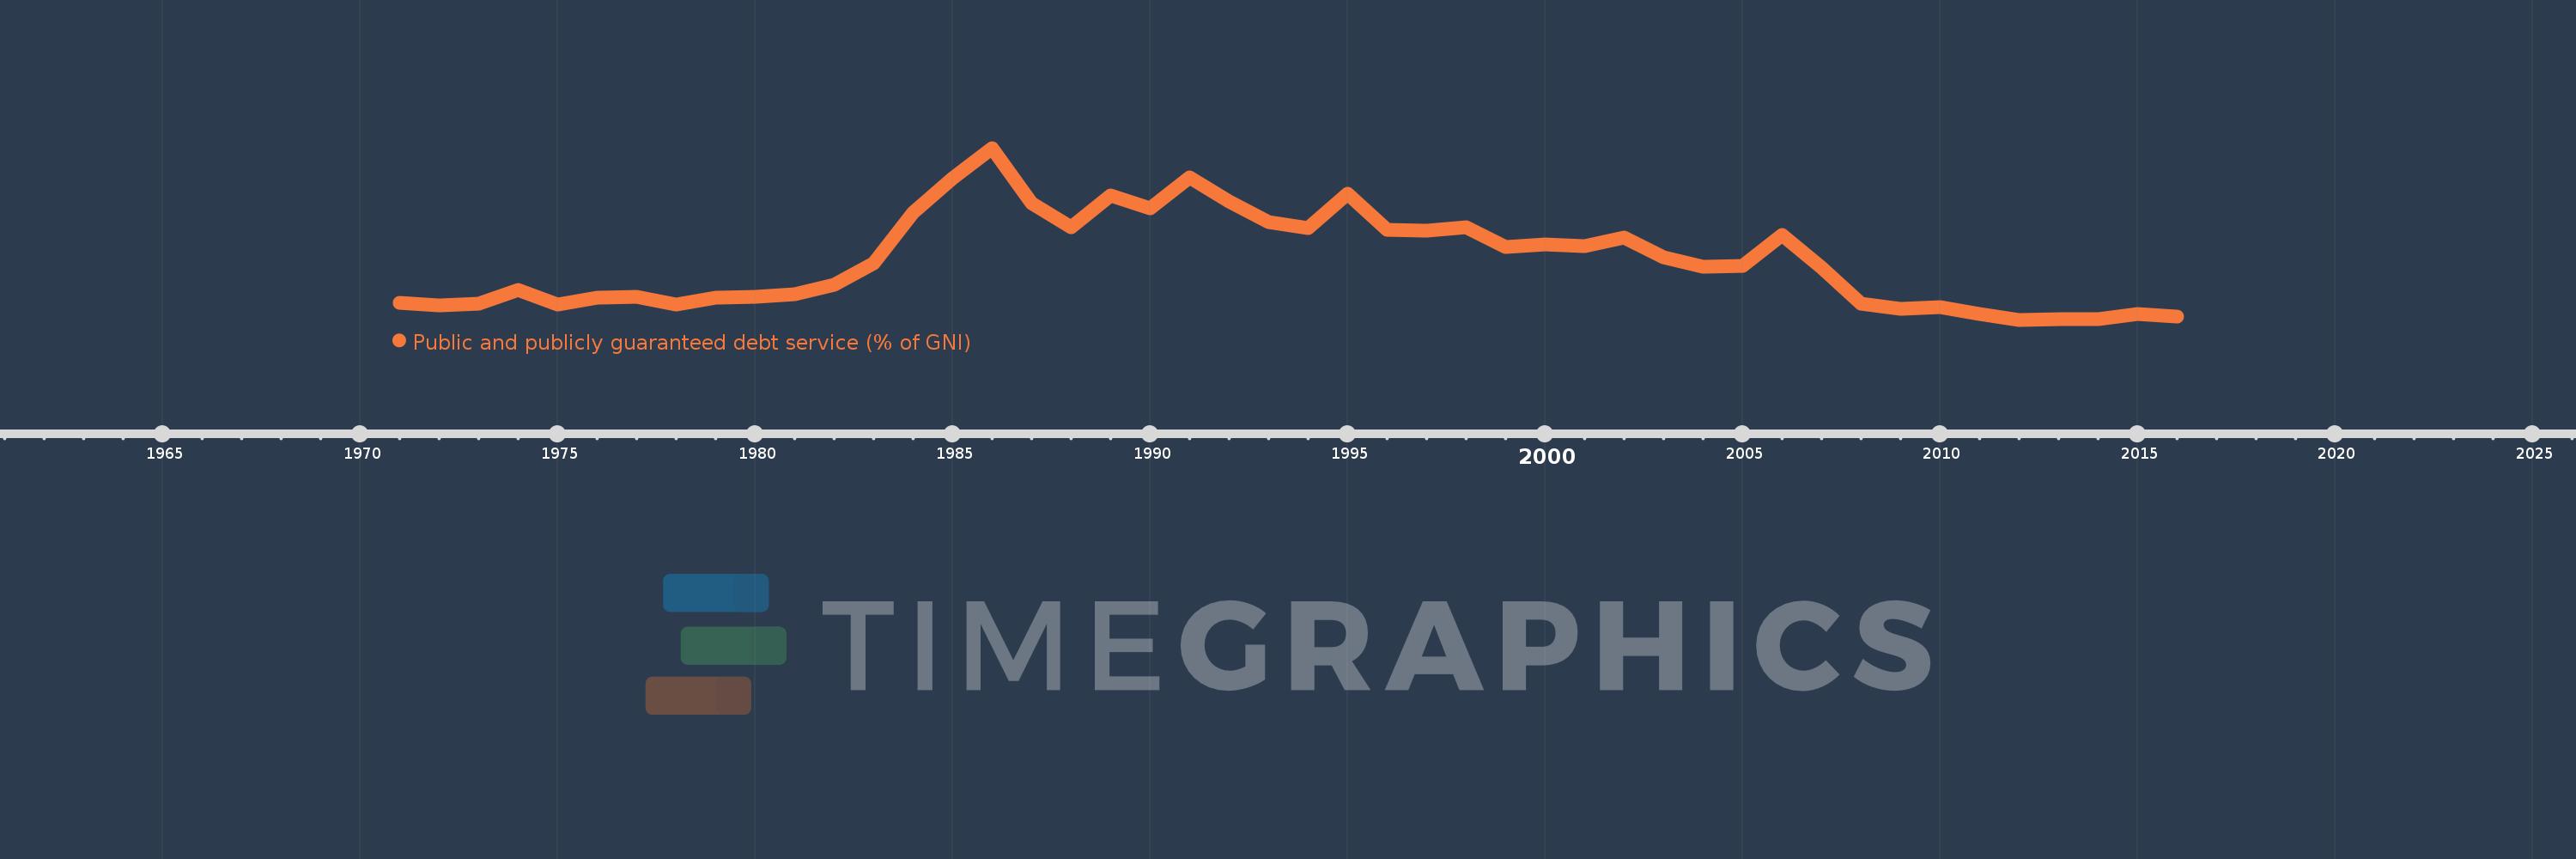
Public and publicly guaranteed debt service (% of GNI)
2016,2015,2014,2013,2012,2011,2010,2009,2008,2007,2006,2005,2004,2003,2002,2001,2000,1999,1998,1997,1996,1995,1994,1993,1992,1991,1990,1989,1988,1987,1986,1985,1984,1983,1982,1981,1980,1979,1978,1977,1976,1975,1974,1973,1972,1971
This statistics in other country:
Timeline:
This timeline shows a graph from 1971 to 2016 of IDA blend. No data until 1970. Number of actual observations by date: 46.
Source name:
World Development Indicators
Source organization:
World Bank, International Debt Statistics.
Categories, topics:
External Debt
Last updated:
apr 23, 2017
Indicators value changes by year
At the date of observation
Value
Absolute change
Change from previous value
jan 1, 1971
1.322
+1.322
0.0%
jan 1, 1972
1.245
-0.077
-5.81%
jan 1, 1973
1.283
+0.038
3.06%
jan 1, 1974
1.791
+0.508
39.63%
jan 1, 1975
1.263
-0.529
-29.53%
jan 1, 1976
1.527
+0.265
20.97%
jan 1, 1977
1.552
+0.025
1.65%
jan 1, 1978
1.256
-0.297
-19.13%
jan 1, 1979
1.511
+0.255
20.31%
jan 1, 1980
1.557
+0.046
3.05%
jan 1, 1981
1.652
+0.095
6.11%
jan 1, 1982
1.99
+0.338
20.47%
jan 1, 1983
2.789
+0.799
40.13%
jan 1, 1984
4.679
+1.891
67.8%
jan 1, 1985
5.937
+1.257
26.87%
jan 1, 1986
7.054
+1.117
18.81%
jan 1, 1987
5.019
-2.035
-28.85%
jan 1, 1988
4.12
-0.899
-17.91%
jan 1, 1989
5.305
+1.185
28.76%
jan 1, 1990
4.829
-0.476
-8.97%
jan 1, 1991
5.957
+1.127
23.35%
jan 1, 1992
5.075
-0.882
-14.81%
jan 1, 1993
4.326
-0.749
-14.75%
jan 1, 1994
4.089
-0.237
-5.47%
jan 1, 1995
5.369
+1.28
31.29%
jan 1, 1996
4.016
-1.353
-25.19%
jan 1, 1997
4.011
-0.005
-0.13%
jan 1, 1998
4.137
+0.127
3.16%
jan 1, 1999
3.39
-0.748
-18.07%
jan 1, 2000
3.494
+0.104
3.07%
jan 1, 2001
3.436
-0.058
-1.65%
jan 1, 2002
3.745
+0.309
8.99%
jan 1, 2003
3.0
-0.745
-19.9%
jan 1, 2004
2.665
-0.335
-11.18%
jan 1, 2005
2.693
+0.028
1.05%
jan 1, 2006
3.85
+1.157
42.98%
jan 1, 2007
2.645
-1.205
-31.3%
jan 1, 2008
1.29
-1.355
-51.22%
jan 1, 2009
1.105
-0.185
-14.33%
jan 1, 2010
1.173
+0.067
6.08%
jan 1, 2011
0.904
-0.268
-22.87%
jan 1, 2012
0.705
-0.199
-22.03%
jan 1, 2013
0.74
+0.035
4.99%
jan 1, 2014
0.729
-0.012
-1.59%
jan 1, 2015
0.907
+0.178
24.45%
jan 1, 2016
0.823
-0.083
-9.18%
Ranking of countries by current statistics by years


Comments: