29
/
en
AIzaSyAYiBZKx7MnpbEhh9jyipgxe19OcubqV5w
April 1, 2024
84707
Benin
BEN
true
2
1
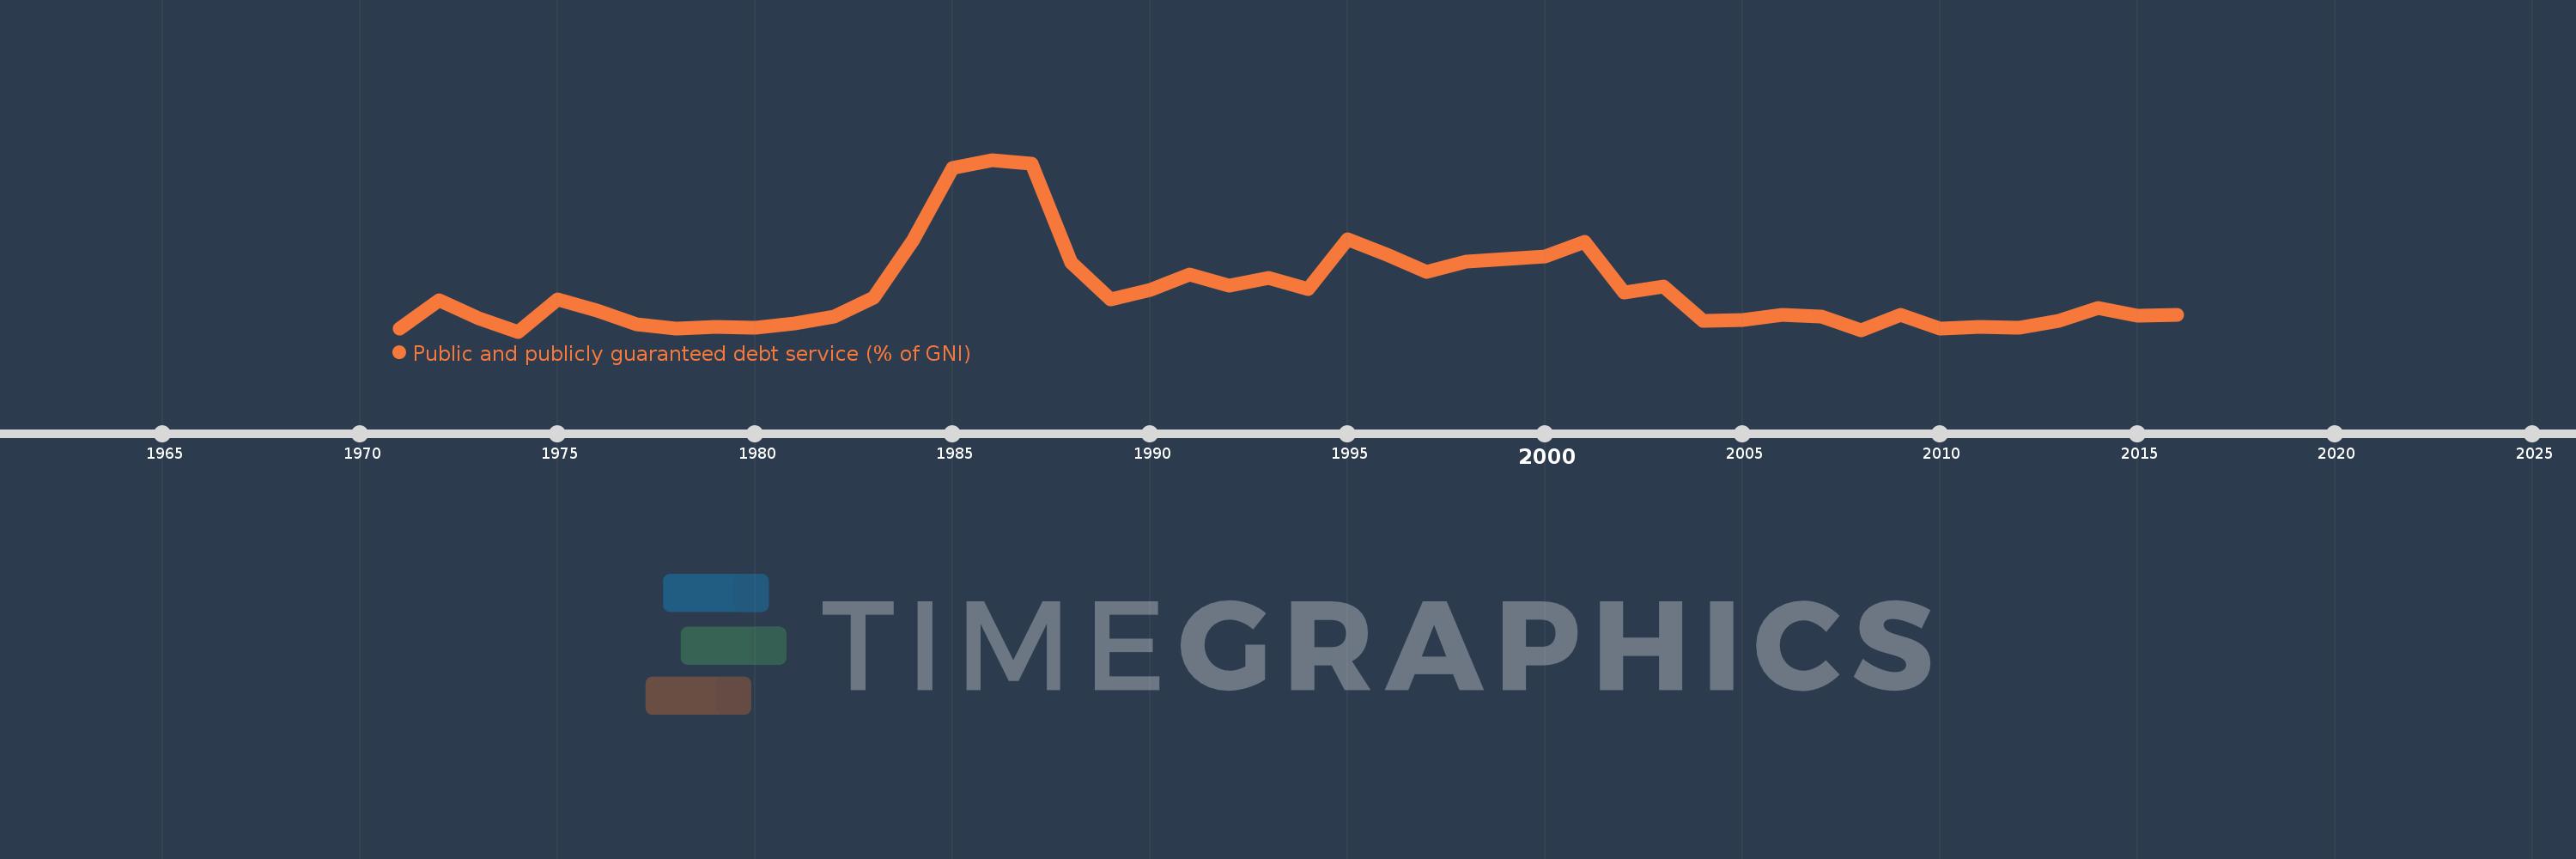
Public and publicly guaranteed debt service (% of GNI)
2016,2015,2014,2013,2012,2011,2010,2009,2008,2007,2006,2005,2004,2003,2002,2001,2000,1999,1998,1997,1996,1995,1994,1993,1992,1991,1990,1989,1988,1987,1986,1985,1984,1983,1982,1981,1980,1979,1978,1977,1976,1975,1974,1973,1972,1971
This statistics in other country:
Timeline:
This timeline shows a graph from 1971 to 2016 of Benin. No data until 1970. Number of actual observations by date: 46.
Source name:
World Development Indicators
Source organization:
World Bank, International Debt Statistics.
Categories, topics:
External Debt
Last updated:
apr 23, 2017
Indicators value changes by year
At the date of observation
Value
Absolute change
Change from previous value
jan 1, 1971
0.526
+0.526
0.0%
jan 1, 1972
1.107
+0.581
110.43%
jan 1, 1973
0.729
-0.378
-34.1%
jan 1, 1974
0.458
-0.271
-37.16%
jan 1, 1975
1.12
+0.661
144.26%
jan 1, 1976
0.901
-0.218
-19.5%
jan 1, 1977
0.615
-0.286
-31.72%
jan 1, 1978
0.517
-0.098
-15.94%
jan 1, 1979
0.556
+0.039
7.48%
jan 1, 1980
0.546
-0.01
-1.73%
jan 1, 1981
0.623
+0.076
13.96%
jan 1, 1982
0.779
+0.156
25.1%
jan 1, 1983
1.154
+0.375
48.1%
jan 1, 1984
2.358
+1.205
104.43%
jan 1, 1985
3.856
+1.497
63.49%
jan 1, 1986
4.026
+0.17
4.41%
jan 1, 1987
3.946
-0.08
-1.98%
jan 1, 1988
1.894
-2.052
-52.0%
jan 1, 1989
1.119
-0.775
-40.93%
jan 1, 1990
1.316
+0.197
17.64%
jan 1, 1991
1.639
+0.323
24.52%
jan 1, 1992
1.411
-0.228
-13.9%
jan 1, 1993
1.566
+0.155
11.01%
jan 1, 1994
1.337
-0.229
-14.62%
jan 1, 1995
2.384
+1.047
78.26%
jan 1, 1996
2.062
-0.323
-13.53%
jan 1, 1997
1.706
-0.355
-17.23%
jan 1, 1998
1.911
+0.204
11.97%
jan 1, 1999
1.968
+0.058
3.02%
jan 1, 2000
2.022
+0.054
2.73%
jan 1, 2001
2.32
+0.298
14.72%
jan 1, 2002
1.27
-1.05
-45.26%
jan 1, 2003
1.401
+0.131
10.29%
jan 1, 2004
0.686
-0.714
-51.0%
jan 1, 2005
0.697
+0.011
1.58%
jan 1, 2006
0.798
+0.101
14.52%
jan 1, 2007
0.768
-0.03
-3.8%
jan 1, 2008
0.483
-0.285
-37.12%
jan 1, 2009
0.801
+0.318
65.91%
jan 1, 2010
0.522
-0.279
-34.84%
jan 1, 2011
0.549
+0.027
5.12%
jan 1, 2012
0.538
-0.011
-2.01%
jan 1, 2013
0.677
+0.139
25.88%
jan 1, 2014
0.945
+0.268
39.58%
jan 1, 2015
0.786
-0.159
-16.81%
jan 1, 2016
0.806
+0.02
2.58%
Ranking of countries by current statistics by years


Comments: