29
/
en
AIzaSyAYiBZKx7MnpbEhh9jyipgxe19OcubqV5w
April 1, 2024
185830
Madagascar
MDG
true
2
1
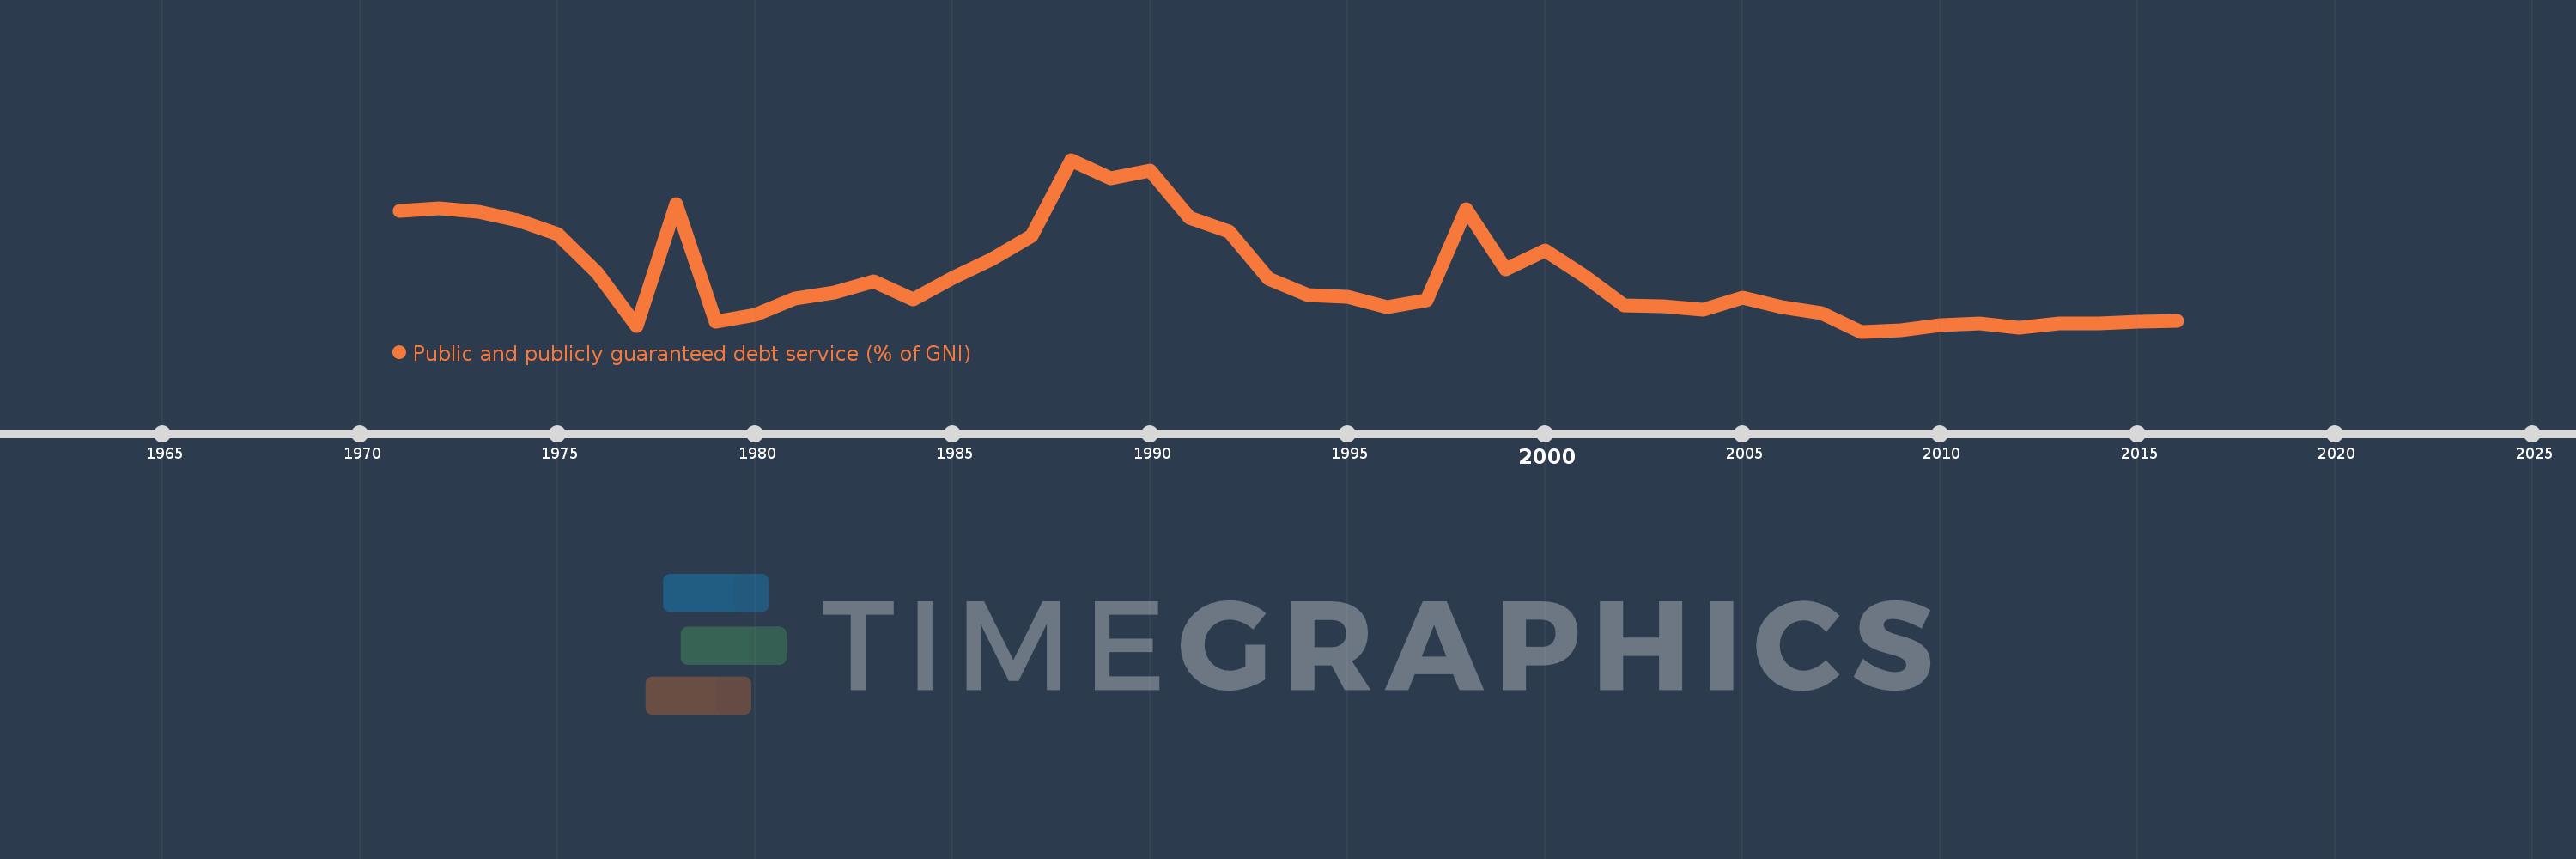
Public and publicly guaranteed debt service (% of GNI)
2016,2015,2014,2013,2012,2011,2010,2009,2008,2007,2006,2005,2004,2003,2002,2001,2000,1999,1998,1997,1996,1995,1994,1993,1992,1991,1990,1989,1988,1987,1986,1985,1984,1983,1982,1981,1980,1979,1978,1977,1976,1975,1974,1973,1972,1971
This statistics in other country:
Timeline:
This timeline shows a graph from 1971 to 2016 of Madagascar. No data until 1970. Number of actual observations by date: 46.
Source name:
World Development Indicators
Source organization:
World Bank, International Debt Statistics.
Categories, topics:
External Debt
Last updated:
apr 23, 2017
Indicators value changes by year
At the date of observation
Value
Absolute change
Change from previous value
jan 1, 1971
5.539
+5.539
0.0%
jan 1, 1972
5.634
+0.095
1.71%
jan 1, 1973
5.47
-0.164
-2.91%
jan 1, 1974
5.113
-0.357
-6.52%
jan 1, 1975
4.516
-0.597
-11.68%
jan 1, 1976
2.827
-1.689
-37.39%
jan 1, 1977
0.506
-2.321
-82.11%
jan 1, 1978
5.806
+5.301
1.05K%
jan 1, 1979
0.676
-5.131
-88.36%
jan 1, 1980
0.977
+0.301
44.57%
jan 1, 1981
1.701
+0.724
74.13%
jan 1, 1982
1.956
+0.255
14.99%
jan 1, 1983
2.434
+0.478
24.42%
jan 1, 1984
1.654
-0.78
-32.05%
jan 1, 1985
2.599
+0.946
57.19%
jan 1, 1986
3.426
+0.827
31.82%
jan 1, 1987
4.424
+0.998
29.12%
jan 1, 1988
7.757
+3.333
75.34%
jan 1, 1989
6.963
-0.795
-10.24%
jan 1, 1990
7.278
+0.315
4.52%
jan 1, 1991
5.229
-2.048
-28.14%
jan 1, 1992
4.632
-0.597
-11.43%
jan 1, 1993
2.548
-2.084
-44.99%
jan 1, 1994
1.837
-0.711
-27.89%
jan 1, 1995
1.776
-0.061
-3.33%
jan 1, 1996
1.324
-0.452
-25.43%
jan 1, 1997
1.606
+0.282
21.26%
jan 1, 1998
5.592
+3.986
248.16%
jan 1, 1999
2.975
-2.616
-46.79%
jan 1, 2000
3.817
+0.842
28.3%
jan 1, 2001
2.684
-1.133
-29.69%
jan 1, 2002
1.392
-1.292
-48.13%
jan 1, 2003
1.354
-0.039
-2.77%
jan 1, 2004
1.202
-0.152
-11.21%
jan 1, 2005
1.747
+0.545
45.34%
jan 1, 2006
1.339
-0.408
-23.37%
jan 1, 2007
1.056
-0.283
-21.12%
jan 1, 2008
0.253
-0.803
-76.05%
jan 1, 2009
0.323
+0.07
27.84%
jan 1, 2010
0.553
+0.23
71.14%
jan 1, 2011
0.604
+0.051
9.24%
jan 1, 2012
0.414
-0.191
-31.56%
jan 1, 2013
0.609
+0.196
47.29%
jan 1, 2014
0.628
+0.019
3.04%
jan 1, 2015
0.688
+0.06
9.62%
jan 1, 2016
0.713
+0.025
3.65%
Ranking of countries by current statistics by years


Comments: