29
/
en
AIzaSyAYiBZKx7MnpbEhh9jyipgxe19OcubqV5w
April 1, 2024
126849
El Salvador
SLV
true
2
1
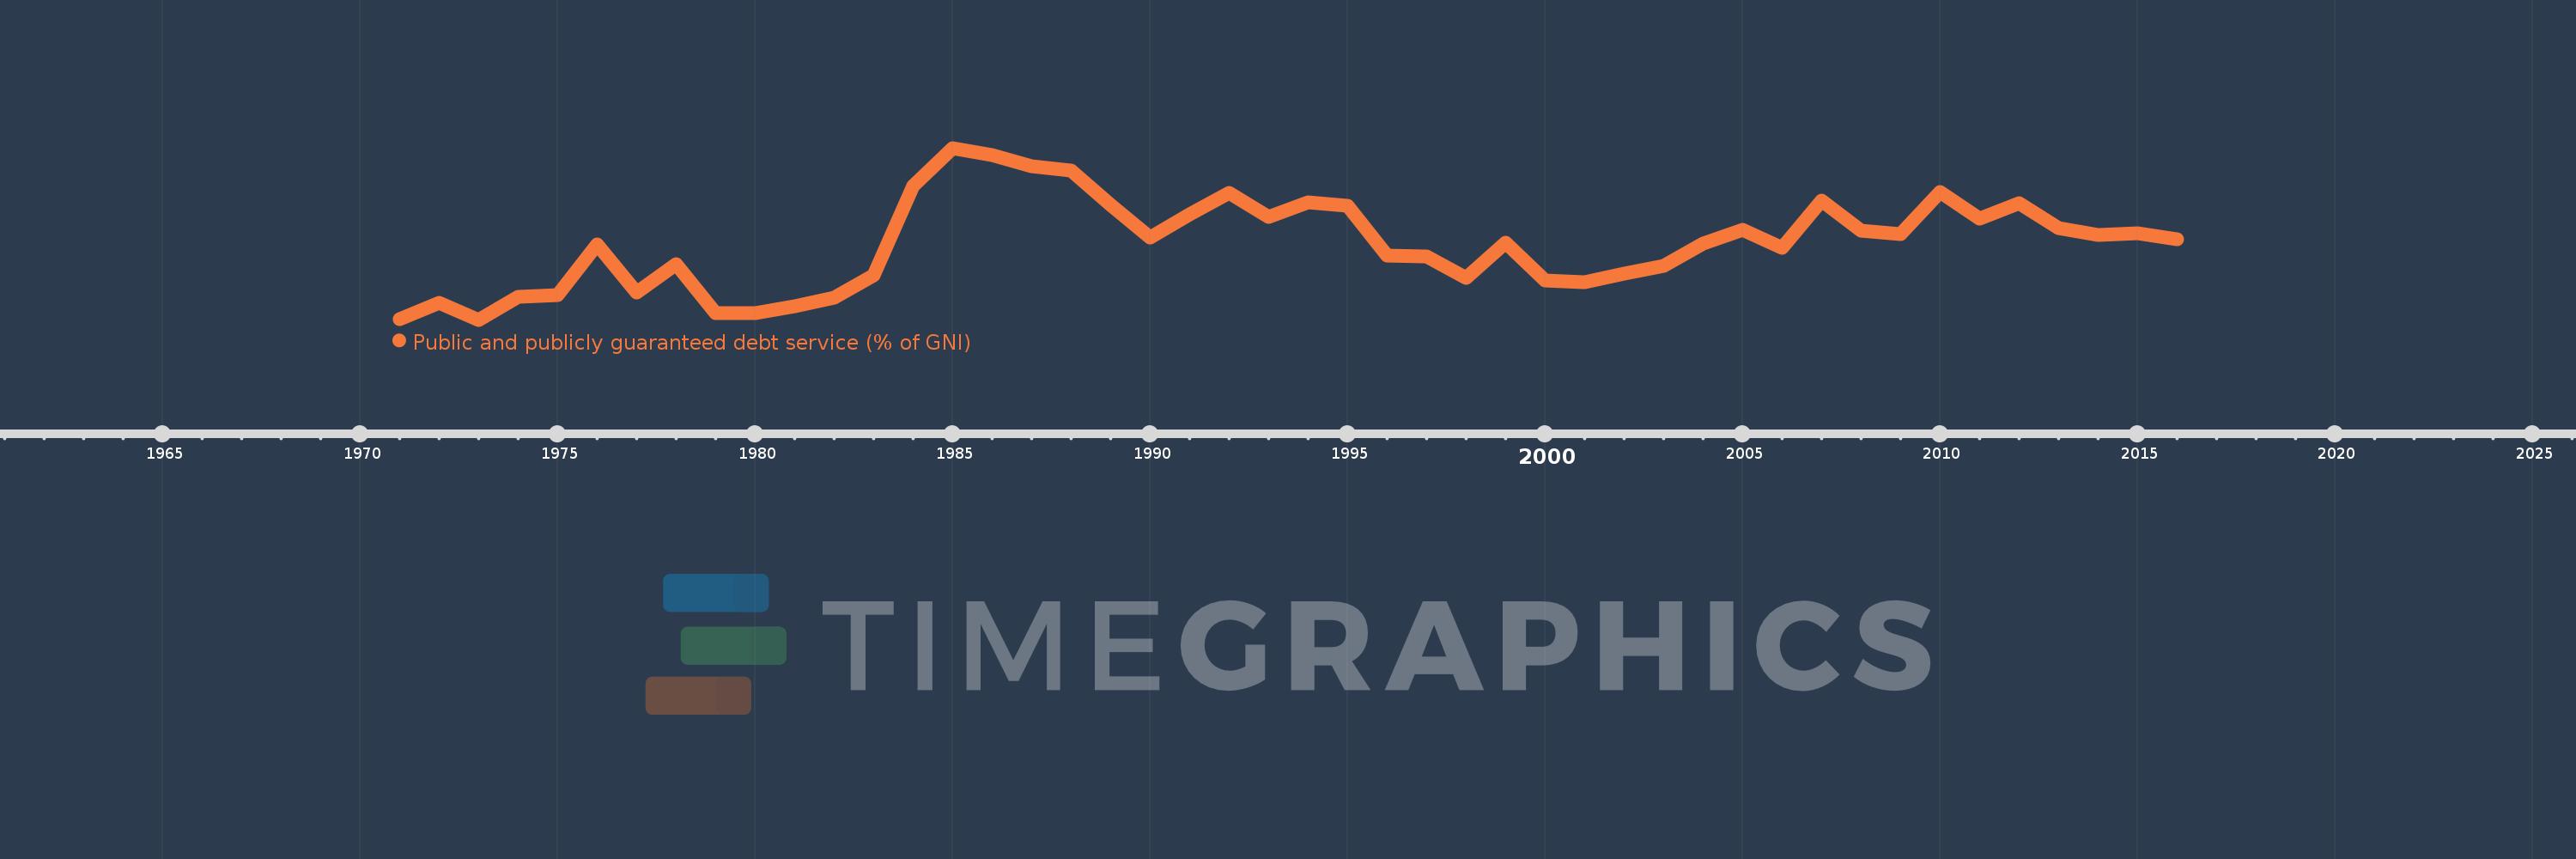
Public and publicly guaranteed debt service (% of GNI)
2016,2015,2014,2013,2012,2011,2010,2009,2008,2007,2006,2005,2004,2003,2002,2001,2000,1999,1998,1997,1996,1995,1994,1993,1992,1991,1990,1989,1988,1987,1986,1985,1984,1983,1982,1981,1980,1979,1978,1977,1976,1975,1974,1973,1972,1971
This statistics in other country:
Timeline:
This timeline shows a graph from 1971 to 2016 of El Salvador. No data until 1970. Number of actual observations by date: 46.
Source name:
World Development Indicators
Source organization:
World Bank, International Debt Statistics.
Categories, topics:
External Debt
Last updated:
apr 23, 2017
Indicators value changes by year
At the date of observation
Value
Absolute change
Change from previous value
jan 1, 1971
0.976
+0.976
0.0%
jan 1, 1972
1.453
+0.477
48.86%
jan 1, 1973
0.958
-0.495
-34.07%
jan 1, 1974
1.624
+0.665
69.44%
jan 1, 1975
1.662
+0.038
2.34%
jan 1, 1976
3.122
+1.46
87.89%
jan 1, 1977
1.735
-1.387
-44.43%
jan 1, 1978
2.559
+0.824
47.5%
jan 1, 1979
1.159
-1.4
-54.72%
jan 1, 1980
1.137
-0.022
-1.86%
jan 1, 1981
1.348
+0.211
18.54%
jan 1, 1982
1.587
+0.239
17.71%
jan 1, 1983
2.239
+0.652
41.1%
jan 1, 1984
4.808
+2.568
114.7%
jan 1, 1985
5.898
+1.091
22.69%
jan 1, 1986
5.693
-0.205
-3.47%
jan 1, 1987
5.376
-0.318
-5.58%
jan 1, 1988
5.237
-0.139
-2.58%
jan 1, 1989
4.251
-0.985
-18.82%
jan 1, 1990
3.32
-0.931
-21.9%
jan 1, 1991
3.982
+0.662
19.92%
jan 1, 1992
4.604
+0.622
15.61%
jan 1, 1993
3.915
-0.688
-14.96%
jan 1, 1994
4.323
+0.408
10.42%
jan 1, 1995
4.225
-0.098
-2.28%
jan 1, 1996
2.81
-1.415
-33.5%
jan 1, 1997
2.781
-0.029
-1.03%
jan 1, 1998
2.169
-0.612
-21.99%
jan 1, 1999
3.167
+0.997
45.98%
jan 1, 2000
2.082
-1.085
-34.26%
jan 1, 2001
2.047
-0.035
-1.67%
jan 1, 2002
2.28
+0.234
11.41%
jan 1, 2003
2.497
+0.217
9.52%
jan 1, 2004
3.154
+0.657
26.31%
jan 1, 2005
3.542
+0.388
12.3%
jan 1, 2006
3.029
-0.513
-14.49%
jan 1, 2007
4.375
+1.346
44.42%
jan 1, 2008
3.512
-0.862
-19.71%
jan 1, 2009
3.42
-0.093
-2.64%
jan 1, 2010
4.64
+1.22
35.68%
jan 1, 2011
3.855
-0.785
-16.92%
jan 1, 2012
4.321
+0.466
12.09%
jan 1, 2013
3.603
-0.718
-16.62%
jan 1, 2014
3.404
-0.198
-5.51%
jan 1, 2015
3.438
+0.034
0.99%
jan 1, 2016
3.264
-0.174
-5.06%
Ranking of countries by current statistics by years


Comments: