29
/
en
AIzaSyAYiBZKx7MnpbEhh9jyipgxe19OcubqV5w
April 1, 2024
268636
Tunisia
TUN
true
2
1
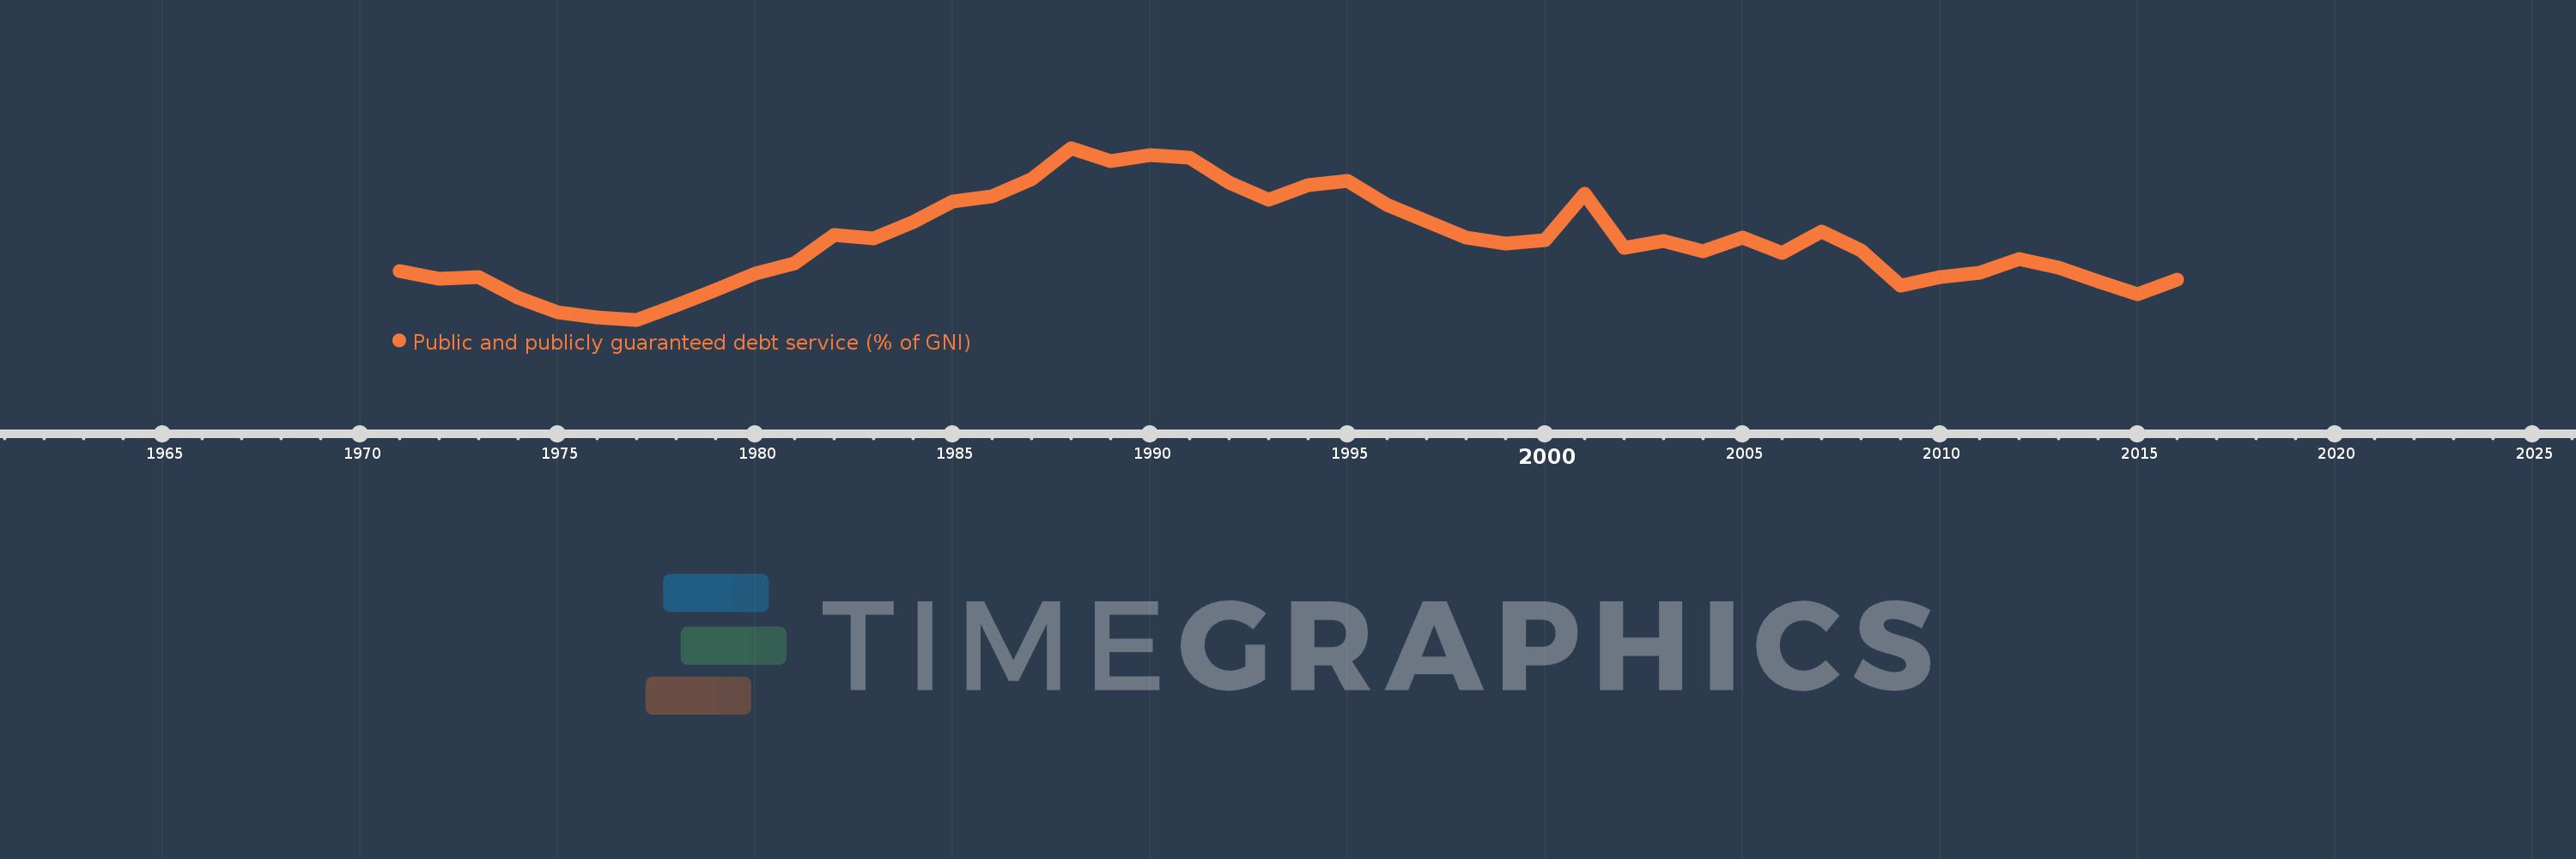
Public and publicly guaranteed debt service (% of GNI)
2016,2015,2014,2013,2012,2011,2010,2009,2008,2007,2006,2005,2004,2003,2002,2001,2000,1999,1998,1997,1996,1995,1994,1993,1992,1991,1990,1989,1988,1987,1986,1985,1984,1983,1982,1981,1980,1979,1978,1977,1976,1975,1974,1973,1972,1971
This statistics in other country:
Timeline:
This timeline shows a graph from 1971 to 2016 of Tunisia. No data until 1970. Number of actual observations by date: 46.
Source name:
World Development Indicators
Source organization:
World Bank, International Debt Statistics.
Categories, topics:
External Debt
Last updated:
apr 23, 2017
Indicators value changes by year
Maximum:
10.731
jan 1, 1988
At the date of observation
Value
Absolute change
Change from previous value
jan 1, 1971
4.739
+4.739
0.0%
jan 1, 1972
4.367
-0.372
-7.85%
jan 1, 1973
4.424
+0.056
1.29%
jan 1, 1974
3.424
-1.0
-22.6%
jan 1, 1975
2.733
-0.691
-20.18%
jan 1, 1976
2.468
-0.265
-9.71%
jan 1, 1977
2.348
-0.12
-4.86%
jan 1, 1978
3.036
+0.689
29.34%
jan 1, 1979
3.79
+0.753
24.81%
jan 1, 1980
4.586
+0.796
21.01%
jan 1, 1981
5.09
+0.505
11.0%
jan 1, 1982
6.472
+1.381
27.13%
jan 1, 1983
6.338
-0.134
-2.06%
jan 1, 1984
7.124
+0.786
12.4%
jan 1, 1985
8.136
+1.012
14.2%
jan 1, 1986
8.356
+0.22
2.7%
jan 1, 1987
9.228
+0.872
10.44%
jan 1, 1988
10.731
+1.503
16.29%
jan 1, 1989
10.08
-0.651
-6.07%
jan 1, 1990
10.395
+0.315
3.12%
jan 1, 1991
10.267
-0.128
-1.23%
jan 1, 1992
9.028
-1.24
-12.07%
jan 1, 1993
8.214
-0.813
-9.01%
jan 1, 1994
8.922
+0.707
8.61%
jan 1, 1995
9.139
+0.217
2.43%
jan 1, 1996
7.957
-1.182
-12.93%
jan 1, 1997
7.143
-0.815
-10.24%
jan 1, 1998
6.348
-0.795
-11.13%
jan 1, 1999
6.083
-0.265
-4.17%
jan 1, 2000
6.216
+0.133
2.18%
jan 1, 2001
8.493
+2.277
36.63%
jan 1, 2002
5.876
-2.618
-30.82%
jan 1, 2003
6.18
+0.304
5.18%
jan 1, 2004
5.706
-0.474
-7.67%
jan 1, 2005
6.359
+0.653
11.44%
jan 1, 2006
5.589
-0.77
-12.1%
jan 1, 2007
6.634
+1.045
18.7%
jan 1, 2008
5.737
-0.897
-13.52%
jan 1, 2009
3.994
-1.744
-30.39%
jan 1, 2010
4.426
+0.432
10.82%
jan 1, 2011
4.628
+0.202
4.57%
jan 1, 2012
5.331
+0.703
15.19%
jan 1, 2013
4.909
-0.423
-7.93%
jan 1, 2014
4.228
-0.681
-13.87%
jan 1, 2015
3.592
-0.636
-15.05%
jan 1, 2016
4.322
+0.73
20.33%
Ranking of countries by current statistics by years


Comments: