29
/
en
AIzaSyAYiBZKx7MnpbEhh9jyipgxe19OcubqV5w
April 1, 2024
279291
Uzbekistan
UZB
true
2
1
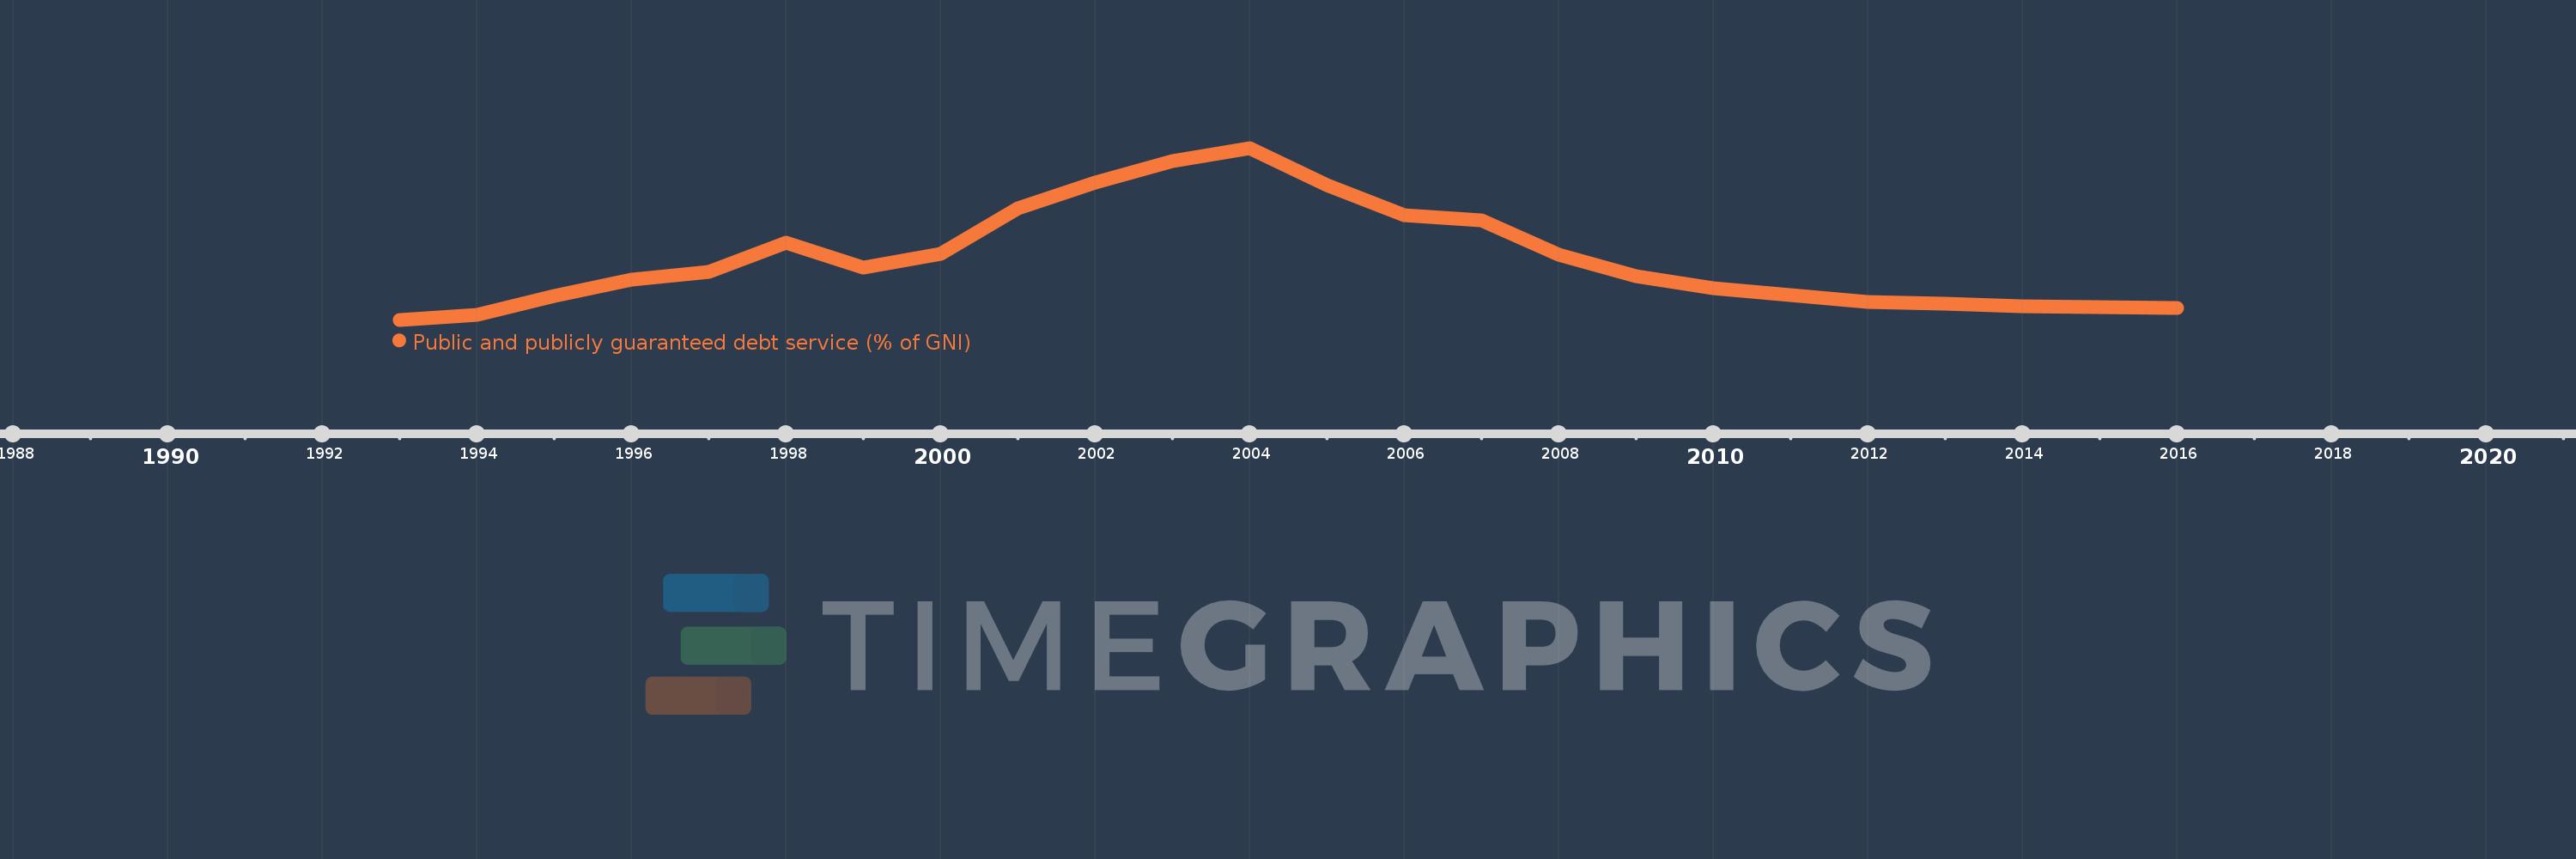
Public and publicly guaranteed debt service (% of GNI)
2016,2015,2014,2013,2012,2011,2010,2009,2008,2007,2006,2005,2004,2003,2002,2001,2000,1999,1998,1997,1996,1995,1994,1993
This statistics in other country:
Timeline:
This timeline shows a graph from 1993 to 2016 of Uzbekistan. No data until 1992. Number of actual observations by date: 24.
Source name:
World Development Indicators
Source organization:
World Bank, International Debt Statistics.
Categories, topics:
External Debt
Last updated:
apr 23, 2017
Indicators value changes by year
At the date of observation
Value
Absolute change
Change from previous value
jan 1, 1993
0.036
+0.036
0.0%
jan 1, 1994
0.227
+0.191
523.99%
jan 1, 1995
1.027
+0.8
352.32%
jan 1, 1996
1.709
+0.682
66.36%
jan 1, 1997
2.018
+0.309
18.09%
jan 1, 1998
3.258
+1.24
61.45%
jan 1, 1999
2.222
-1.036
-31.79%
jan 1, 2000
2.791
+0.568
25.58%
jan 1, 2001
4.662
+1.871
67.05%
jan 1, 2002
5.756
+1.094
23.47%
jan 1, 2003
6.651
+0.895
15.55%
jan 1, 2004
7.185
+0.533
8.02%
jan 1, 2005
5.655
-1.53
-21.29%
jan 1, 2006
4.39
-1.265
-22.37%
jan 1, 2007
4.165
-0.225
-5.12%
jan 1, 2008
2.734
-1.431
-34.35%
jan 1, 2009
1.837
-0.897
-32.81%
jan 1, 2010
1.354
-0.483
-26.3%
jan 1, 2011
1.069
-0.285
-21.05%
jan 1, 2012
0.761
-0.308
-28.78%
jan 1, 2013
0.691
-0.07
-9.24%
jan 1, 2014
0.583
-0.108
-15.62%
jan 1, 2015
0.573
-0.01
-1.7%
jan 1, 2016
0.529
-0.044
-7.75%
Ranking of countries by current statistics by years


Comments: