29
/
en
AIzaSyAYiBZKx7MnpbEhh9jyipgxe19OcubqV5w
April 1, 2024
190854
Mali
MLI
true
2
1
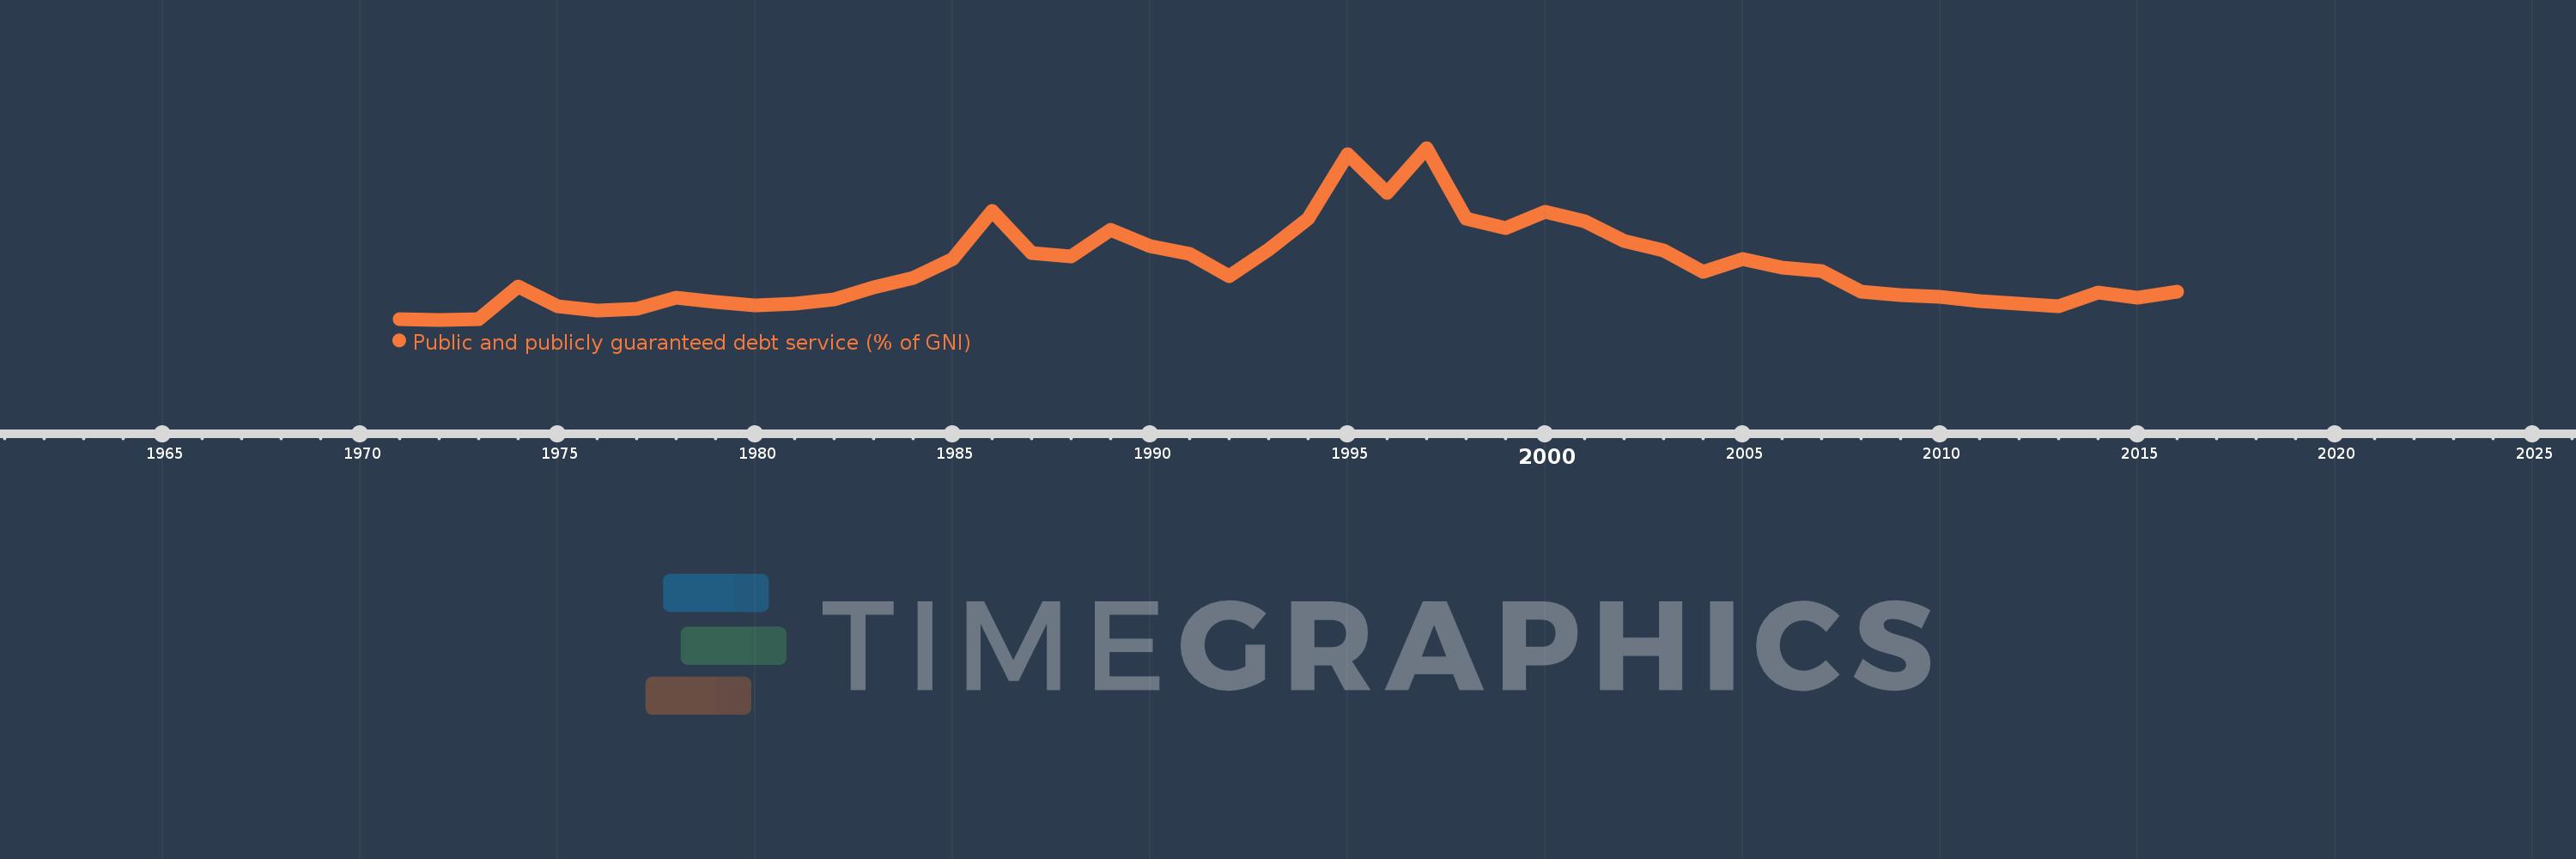
Public and publicly guaranteed debt service (% of GNI)
2016,2015,2014,2013,2012,2011,2010,2009,2008,2007,2006,2005,2004,2003,2002,2001,2000,1999,1998,1997,1996,1995,1994,1993,1992,1991,1990,1989,1988,1987,1986,1985,1984,1983,1982,1981,1980,1979,1978,1977,1976,1975,1974,1973,1972,1971
This statistics in other country:
Timeline:
This timeline shows a graph from 1971 to 2016 of Mali. No data until 1970. Number of actual observations by date: 46.
Source name:
World Development Indicators
Source organization:
World Bank, International Debt Statistics.
Categories, topics:
External Debt
Last updated:
apr 23, 2017
Indicators value changes by year
At the date of observation
Value
Absolute change
Change from previous value
jan 1, 1971
0.201
+0.201
0.0%
jan 1, 1972
0.187
-0.013
-6.66%
jan 1, 1973
0.2
+0.013
6.88%
jan 1, 1974
0.902
+0.702
350.43%
jan 1, 1975
0.485
-0.417
-46.23%
jan 1, 1976
0.393
-0.092
-18.89%
jan 1, 1977
0.43
+0.037
9.32%
jan 1, 1978
0.661
+0.231
53.65%
jan 1, 1979
0.564
-0.097
-14.71%
jan 1, 1980
0.503
-0.061
-10.77%
jan 1, 1981
0.539
+0.036
7.17%
jan 1, 1982
0.63
+0.091
16.95%
jan 1, 1983
0.881
+0.25
39.7%
jan 1, 1984
1.094
+0.213
24.21%
jan 1, 1985
1.491
+0.397
36.27%
jan 1, 1986
2.52
+1.03
69.08%
jan 1, 1987
1.624
-0.896
-35.54%
jan 1, 1988
1.55
-0.075
-4.59%
jan 1, 1989
2.114
+0.565
36.43%
jan 1, 1990
1.777
-0.338
-15.97%
jan 1, 1991
1.608
-0.169
-9.51%
jan 1, 1992
1.117
-0.49
-30.5%
jan 1, 1993
1.689
+0.572
51.19%
jan 1, 1994
2.366
+0.677
40.07%
jan 1, 1995
3.746
+1.38
58.31%
jan 1, 1996
2.914
-0.832
-22.21%
jan 1, 1997
3.881
+0.967
33.18%
jan 1, 1998
2.363
-1.518
-39.11%
jan 1, 1999
2.165
-0.198
-8.39%
jan 1, 2000
2.506
+0.341
15.76%
jan 1, 2001
2.308
-0.198
-7.89%
jan 1, 2002
1.887
-0.421
-18.25%
jan 1, 2003
1.671
-0.216
-11.47%
jan 1, 2004
1.223
-0.447
-26.77%
jan 1, 2005
1.494
+0.271
22.15%
jan 1, 2006
1.315
-0.18
-12.01%
jan 1, 2007
1.242
-0.073
-5.54%
jan 1, 2008
0.79
-0.452
-36.36%
jan 1, 2009
0.722
-0.068
-8.64%
jan 1, 2010
0.68
-0.042
-5.79%
jan 1, 2011
0.592
-0.089
-13.01%
jan 1, 2012
0.527
-0.065
-10.94%
jan 1, 2013
0.479
-0.048
-9.17%
jan 1, 2014
0.774
+0.296
61.76%
jan 1, 2015
0.661
-0.114
-14.67%
jan 1, 2016
0.788
+0.127
19.29%
Ranking of countries by current statistics by years


Comments: