29
/pt/
pt
AIzaSyAYiBZKx7MnpbEhh9jyipgxe19OcubqV5w
April 1, 2024
184507
Macedonia, FYR
MKD
true
2
1
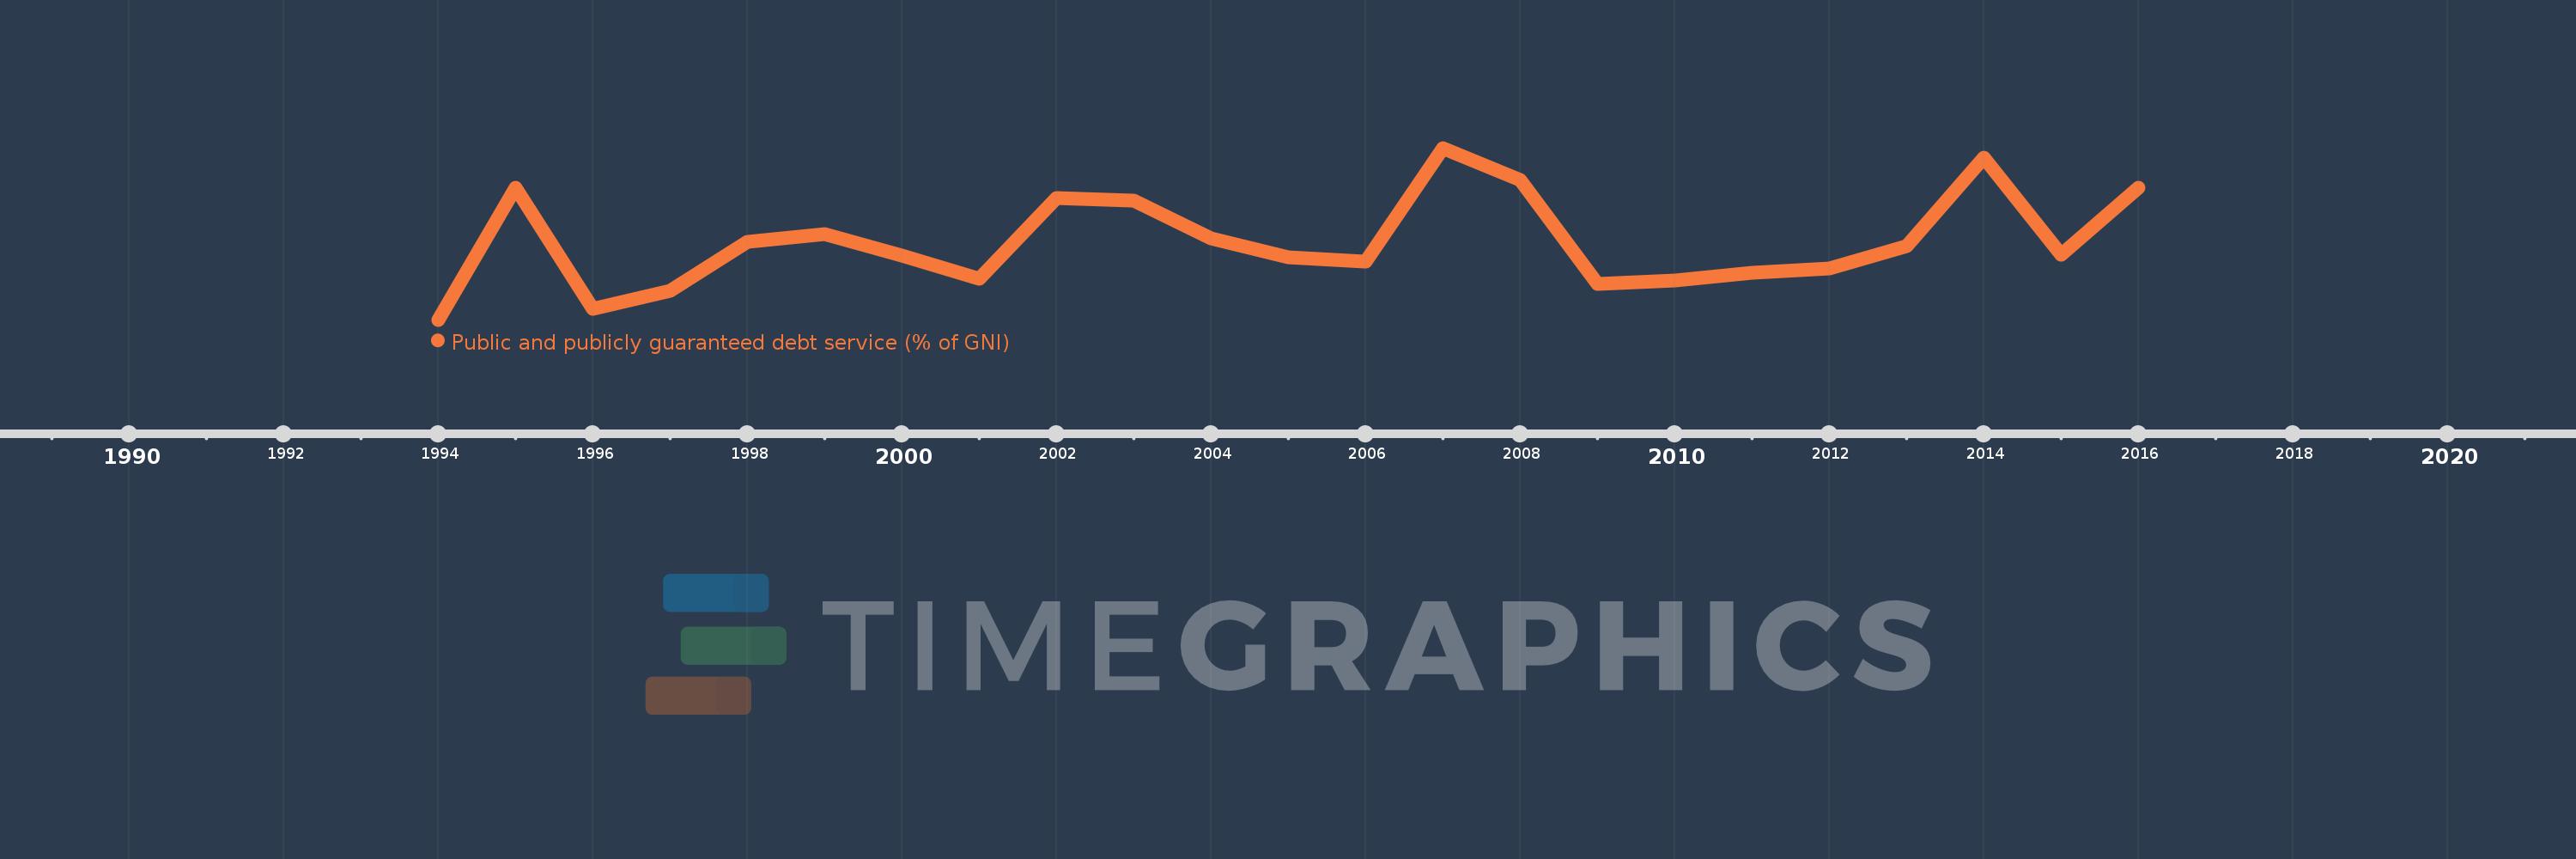
Public and publicly guaranteed debt service (% of GNI)
2016,2015,2014,2013,2012,2011,2010,2009,2008,2007,2006,2005,2004,2003,2002,2001,2000,1999,1998,1997,1996,1995,1994
Estas estatísticas em outros países:
Linha do tempo:
Nesta escala de tempo está apresentado um gráfico de 1994 ano até 2016 ano Macedonia, FYR. Dados de 1993 ano ausente. O número de observações reais por data: 23.
Fonte (nome):
Indicadores de desenvolvimento mundial
Fonte (organização):
World Bank, International Debt Statistics.
Categorias:
External Debt
Foi atualizado:
23 abr 2017 ano
Indicadores de alterações dos valores ao longo dos anos
Mínimo:
0.315
1 jan 1994 ano
Máximo:
5.253
1 jan 2007 ano
Na data de observação
Valor
Mudança absoluta
A alteração em relação ao valor anterior
1 jan 1994 ano
0.315
+0.315
0.0%
1 jan 1995 ano
4.12
+3.805
1.21 mil%
1 jan 1996 ano
0.64
-3.479
-84.46%
1 jan 1997 ano
1.152
+0.512
79.98%
1 jan 1998 ano
2.551
+1.398
121.33%
1 jan 1999 ano
2.785
+0.234
9.18%
1 jan 2000 ano
2.166
-0.618
-22.21%
1 jan 2001 ano
1.493
-0.674
-31.1%
1 jan 2002 ano
3.802
+2.309
154.72%
1 jan 2003 ano
3.749
-0.053
-1.39%
1 jan 2004 ano
2.656
-1.093
-29.16%
1 jan 2005 ano
2.109
-0.547
-20.59%
1 jan 2006 ano
1.987
-0.122
-5.78%
1 jan 2007 ano
5.253
+3.266
164.39%
1 jan 2008 ano
4.337
-0.916
-17.43%
1 jan 2009 ano
1.353
-2.984
-68.8%
1 jan 2010 ano
1.445
+0.092
6.8%
1 jan 2011 ano
1.67
+0.225
15.54%
1 jan 2012 ano
1.8
+0.131
7.83%
1 jan 2013 ano
2.441
+0.64
35.55%
1 jan 2014 ano
4.975
+2.534
103.85%
1 jan 2015 ano
2.19
-2.785
-55.99%
1 jan 2016 ano
4.108
+1.918
87.6%
Classificação de países por estatísticas atuais por anos


Comentários: