29
/pt/
pt
AIzaSyAYiBZKx7MnpbEhh9jyipgxe19OcubqV5w
April 1, 2024
179461
Liberia
LBR
true
2
1
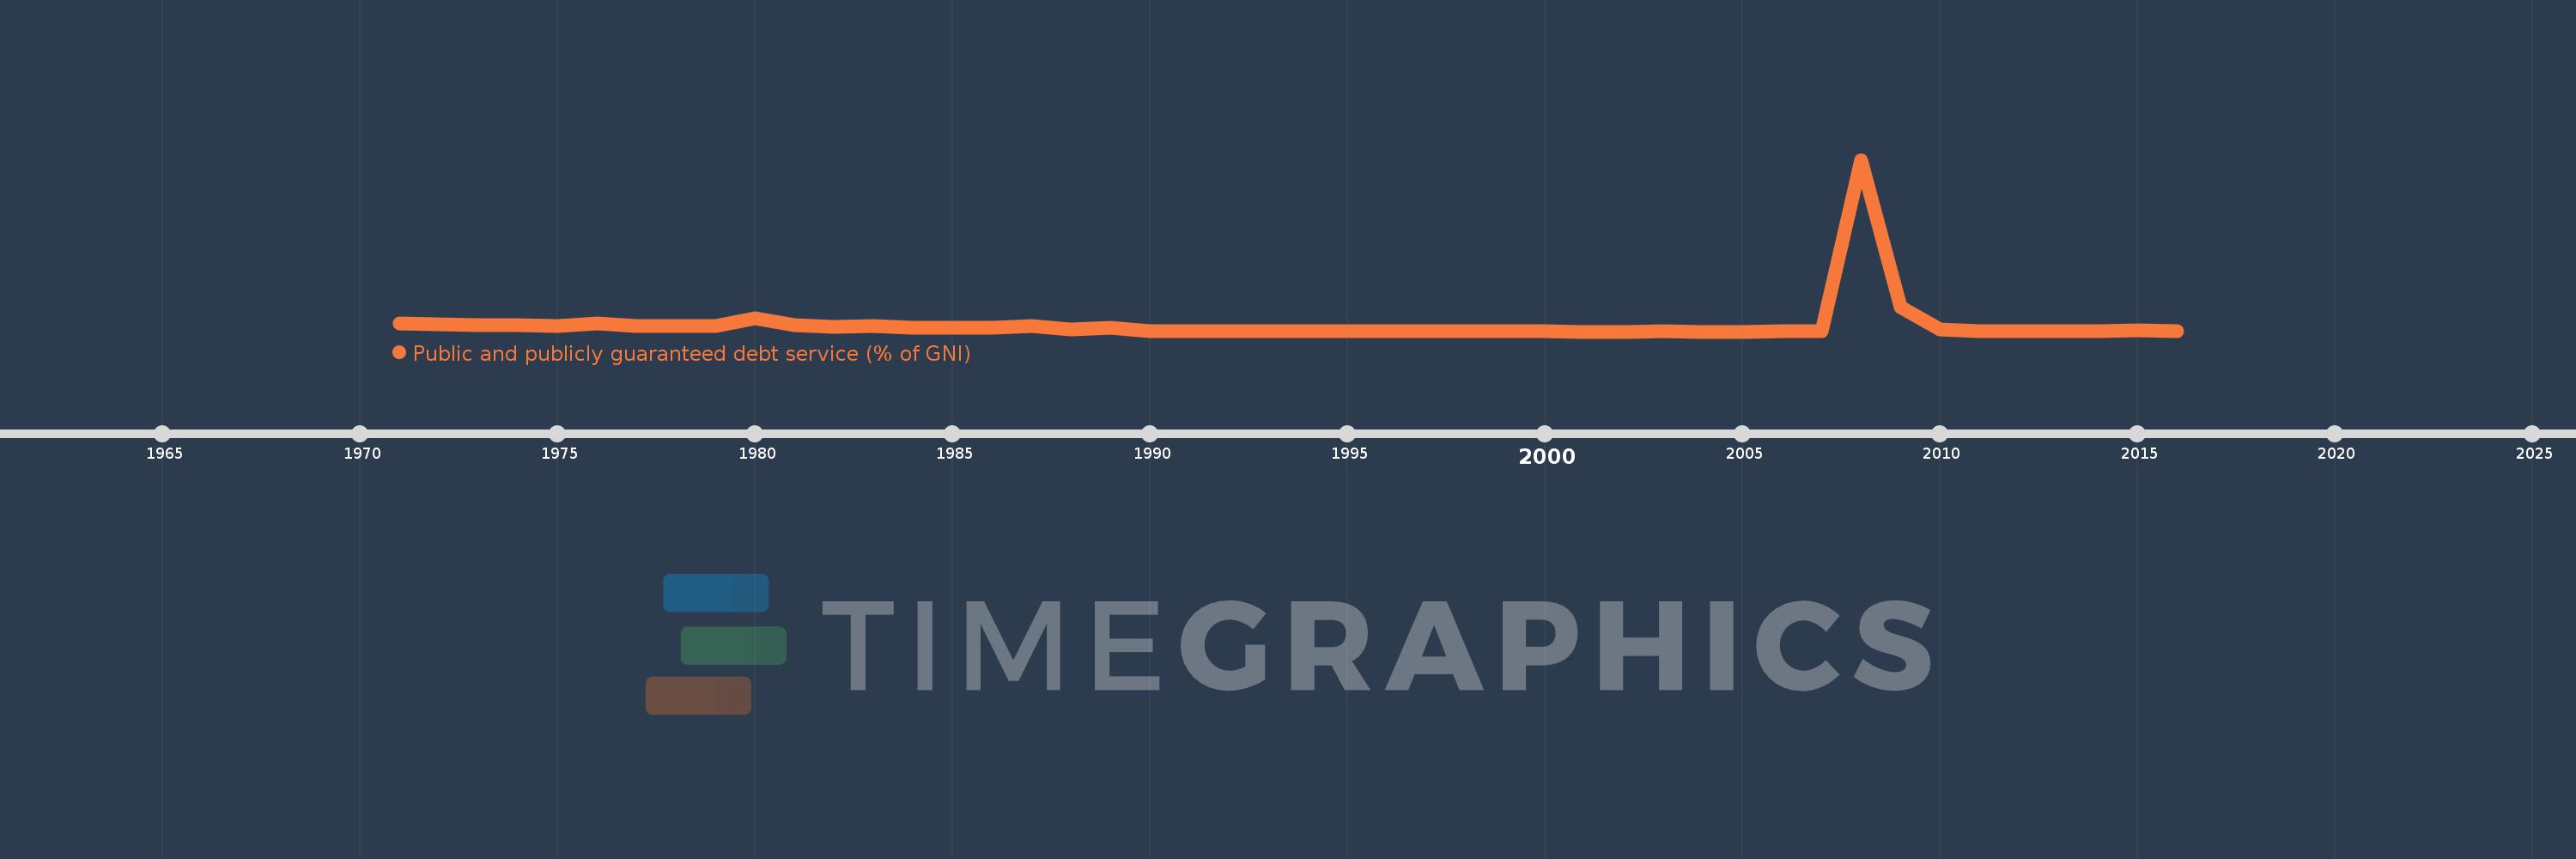
Public and publicly guaranteed debt service (% of GNI)
2016,2015,2014,2013,2012,2011,2010,2009,2008,2007,2006,2005,2004,2003,2002,2001,2000,1999,1998,1990,1989,1988,1987,1986,1985,1984,1983,1982,1981,1980,1979,1978,1977,1976,1975,1974,1973,1972,1971
Estas estatísticas em outros países:
Linha do tempo:
Nesta escala de tempo está apresentado um gráfico de 1971 ano até 2016 ano Liberia. Dados de 1970 ano ausente. O número de observações reais por data: 39.
Fonte (nome):
Indicadores de desenvolvimento mundial
Fonte (organização):
World Bank, International Debt Statistics.
Categorias:
External Debt
Foi atualizado:
23 abr 2017 ano
Indicadores de alterações dos valores ao longo dos anos
Máximo:
109.649
1 jan 2008 ano
Na data de observação
Valor
Mudança absoluta
A alteração em relação ao valor anterior
1 jan 1971 ano
5.105
+5.105
0.0%
1 jan 1972 ano
4.631
-0.475
-9.3%
1 jan 1973 ano
4.27
-0.36
-7.78%
1 jan 1974 ano
4.139
-0.131
-3.07%
1 jan 1975 ano
3.739
-0.4
-9.67%
1 jan 1976 ano
5.275
+1.536
41.09%
1 jan 1977 ano
3.311
-1.964
-37.24%
1 jan 1978 ano
3.554
+0.243
7.34%
1 jan 1979 ano
3.294
-0.26
-7.31%
1 jan 1980 ano
8.32
+5.026
152.55%
1 jan 1981 ano
4.082
-4.238
-50.94%
1 jan 1982 ano
2.788
-1.294
-31.69%
1 jan 1983 ano
3.725
+0.937
33.59%
1 jan 1984 ano
2.577
-1.148
-30.82%
1 jan 1985 ano
2.409
-0.168
-6.53%
1 jan 1986 ano
2.299
-0.109
-4.53%
1 jan 1987 ano
3.804
+1.504
65.42%
1 jan 1988 ano
1.572
-2.232
-58.68%
1 jan 1989 ano
2.266
+0.694
44.15%
1 jan 1990 ano
0.498
-1.768
-78.02%
1 jan 1998 ano
0.019
-0.479
-96.25%
1 jan 1999 ano
0.012
-0.007
-36.51%
1 jan 2000 ano
0.008
-0.004
-31.82%
1 jan 2001 ano
0.0
-0.008
-100.0%
1 jan 2003 ano
0.005
+0.005
%
1 jan 2004 ano
0.0
-0.005
-100.0%
1 jan 2006 ano
0.008
+0.008
%
1 jan 2007 ano
0.011
+0.003
30.88%
1 jan 2008 ano
109.649
+109.639
1.03 milhões%
1 jan 2009 ano
15.424
-94.225
-85.93%
1 jan 2010 ano
1.593
-13.831
-89.67%
1 jan 2011 ano
0.389
-1.203
-75.55%
1 jan 2012 ano
0.211
-0.178
-45.83%
1 jan 2013 ano
0.309
+0.098
46.36%
1 jan 2014 ano
0.376
+0.067
21.67%
1 jan 2015 ano
0.844
+0.469
124.78%
1 jan 2016 ano
0.275
-0.57
-67.47%
Classificação de países por estatísticas atuais por anos


Comentários: