29
/pt/
pt
AIzaSyAYiBZKx7MnpbEhh9jyipgxe19OcubqV5w
April 1, 2024
38534
IDA blend
IDB
false
2
1
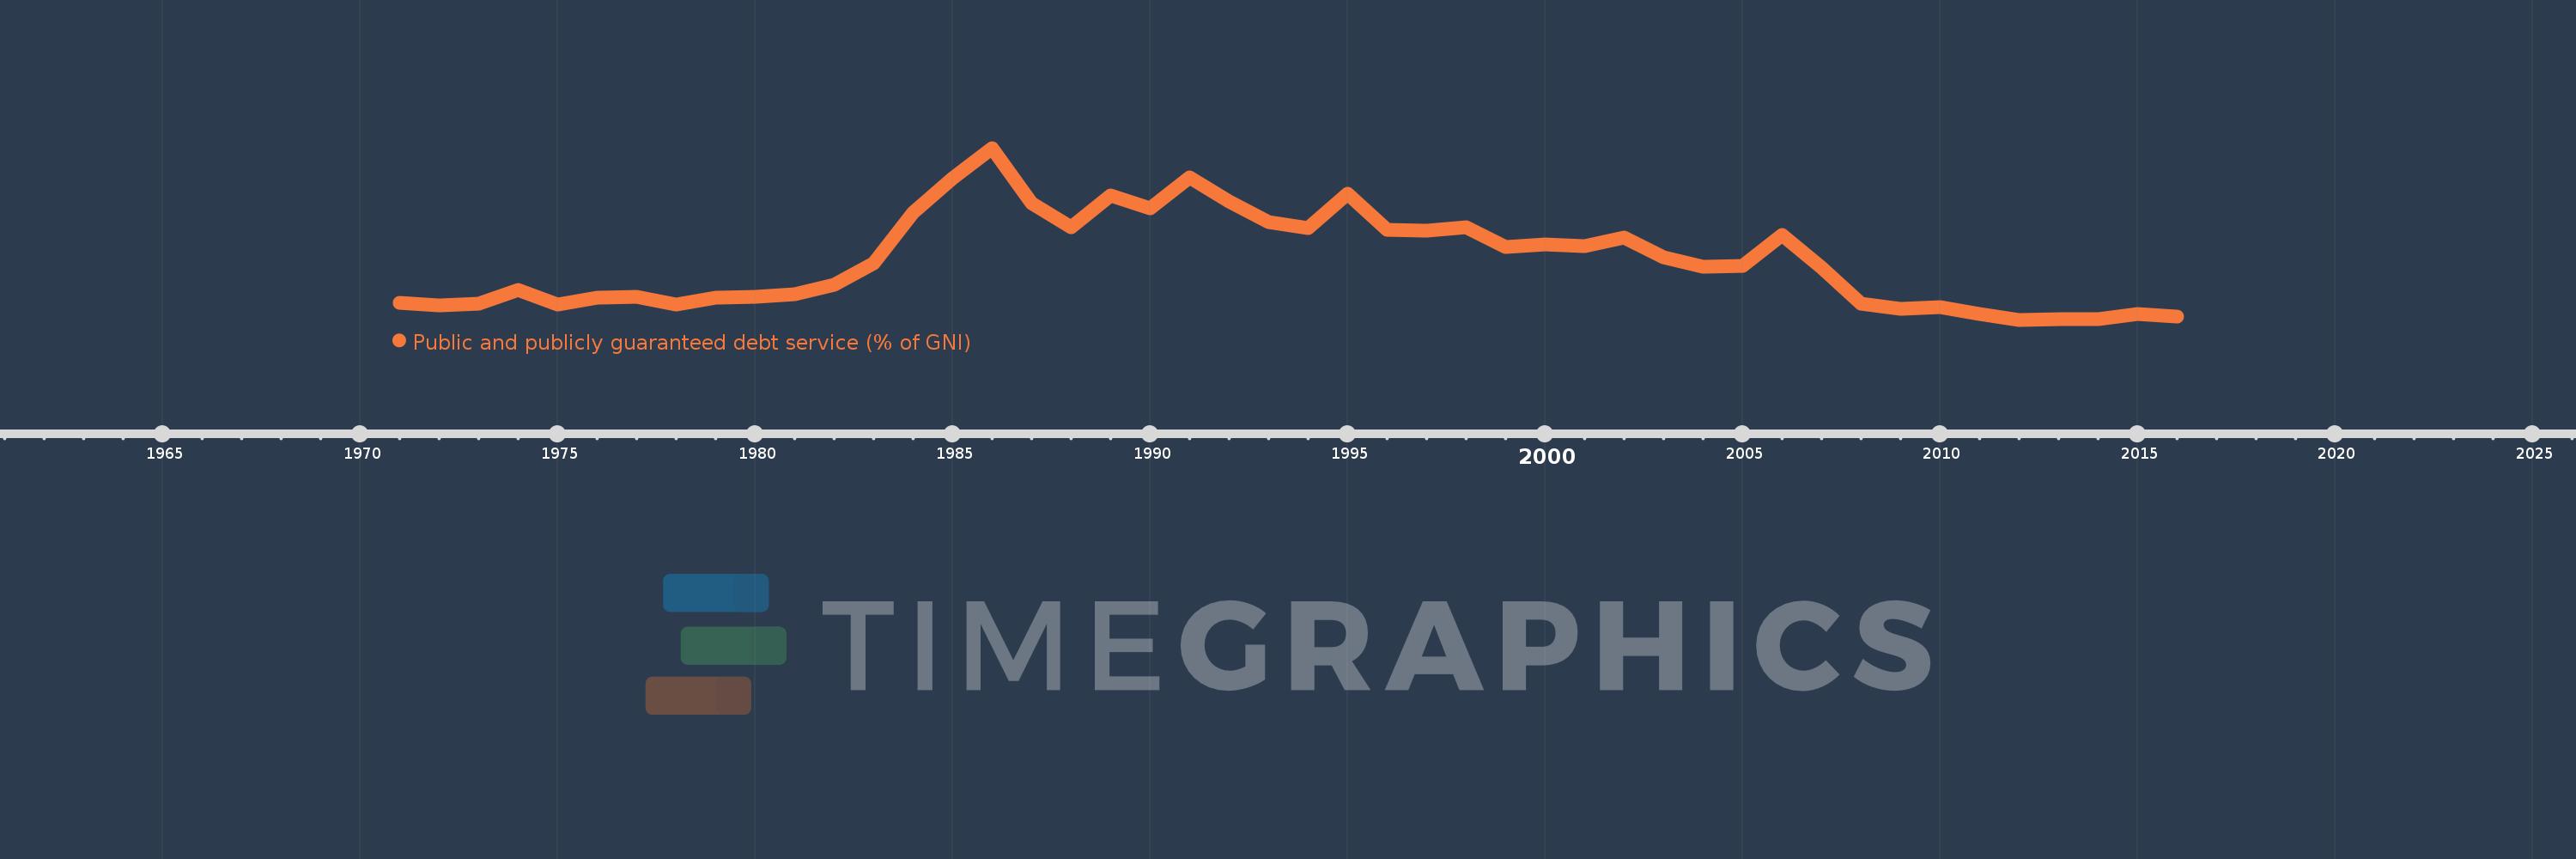
Public and publicly guaranteed debt service (% of GNI)
2016,2015,2014,2013,2012,2011,2010,2009,2008,2007,2006,2005,2004,2003,2002,2001,2000,1999,1998,1997,1996,1995,1994,1993,1992,1991,1990,1989,1988,1987,1986,1985,1984,1983,1982,1981,1980,1979,1978,1977,1976,1975,1974,1973,1972,1971
Estas estatísticas em outros países:
Linha do tempo:
Nesta escala de tempo está apresentado um gráfico de 1971 ano até 2016 ano IDA blend. Dados de 1970 ano ausente. O número de observações reais por data: 46.
Fonte (nome):
Indicadores de desenvolvimento mundial
Fonte (organização):
World Bank, International Debt Statistics.
Categorias:
External Debt
Foi atualizado:
23 abr 2017 ano
Indicadores de alterações dos valores ao longo dos anos
Mínimo:
0.705
1 jan 2012 ano
Máximo:
7.054
1 jan 1986 ano
Na data de observação
Valor
Mudança absoluta
A alteração em relação ao valor anterior
1 jan 1971 ano
1.322
+1.322
0.0%
1 jan 1972 ano
1.245
-0.077
-5.81%
1 jan 1973 ano
1.283
+0.038
3.06%
1 jan 1974 ano
1.791
+0.508
39.63%
1 jan 1975 ano
1.263
-0.529
-29.53%
1 jan 1976 ano
1.527
+0.265
20.97%
1 jan 1977 ano
1.552
+0.025
1.65%
1 jan 1978 ano
1.256
-0.297
-19.13%
1 jan 1979 ano
1.511
+0.255
20.31%
1 jan 1980 ano
1.557
+0.046
3.05%
1 jan 1981 ano
1.652
+0.095
6.11%
1 jan 1982 ano
1.99
+0.338
20.47%
1 jan 1983 ano
2.789
+0.799
40.13%
1 jan 1984 ano
4.679
+1.891
67.8%
1 jan 1985 ano
5.937
+1.257
26.87%
1 jan 1986 ano
7.054
+1.117
18.81%
1 jan 1987 ano
5.019
-2.035
-28.85%
1 jan 1988 ano
4.12
-0.899
-17.91%
1 jan 1989 ano
5.305
+1.185
28.76%
1 jan 1990 ano
4.829
-0.476
-8.97%
1 jan 1991 ano
5.957
+1.127
23.35%
1 jan 1992 ano
5.075
-0.882
-14.81%
1 jan 1993 ano
4.326
-0.749
-14.75%
1 jan 1994 ano
4.089
-0.237
-5.47%
1 jan 1995 ano
5.369
+1.28
31.29%
1 jan 1996 ano
4.016
-1.353
-25.19%
1 jan 1997 ano
4.011
-0.005
-0.13%
1 jan 1998 ano
4.137
+0.127
3.16%
1 jan 1999 ano
3.39
-0.748
-18.07%
1 jan 2000 ano
3.494
+0.104
3.07%
1 jan 2001 ano
3.436
-0.058
-1.65%
1 jan 2002 ano
3.745
+0.309
8.99%
1 jan 2003 ano
3.0
-0.745
-19.9%
1 jan 2004 ano
2.665
-0.335
-11.18%
1 jan 2005 ano
2.693
+0.028
1.05%
1 jan 2006 ano
3.85
+1.157
42.98%
1 jan 2007 ano
2.645
-1.205
-31.3%
1 jan 2008 ano
1.29
-1.355
-51.22%
1 jan 2009 ano
1.105
-0.185
-14.33%
1 jan 2010 ano
1.173
+0.067
6.08%
1 jan 2011 ano
0.904
-0.268
-22.87%
1 jan 2012 ano
0.705
-0.199
-22.03%
1 jan 2013 ano
0.74
+0.035
4.99%
1 jan 2014 ano
0.729
-0.012
-1.59%
1 jan 2015 ano
0.907
+0.178
24.45%
1 jan 2016 ano
0.823
-0.083
-9.18%
Classificação de países por estatísticas atuais por anos


Comentários: