29
/pt/
pt
AIzaSyAYiBZKx7MnpbEhh9jyipgxe19OcubqV5w
April 1, 2024
65364
Albania
ALB
true
2
1
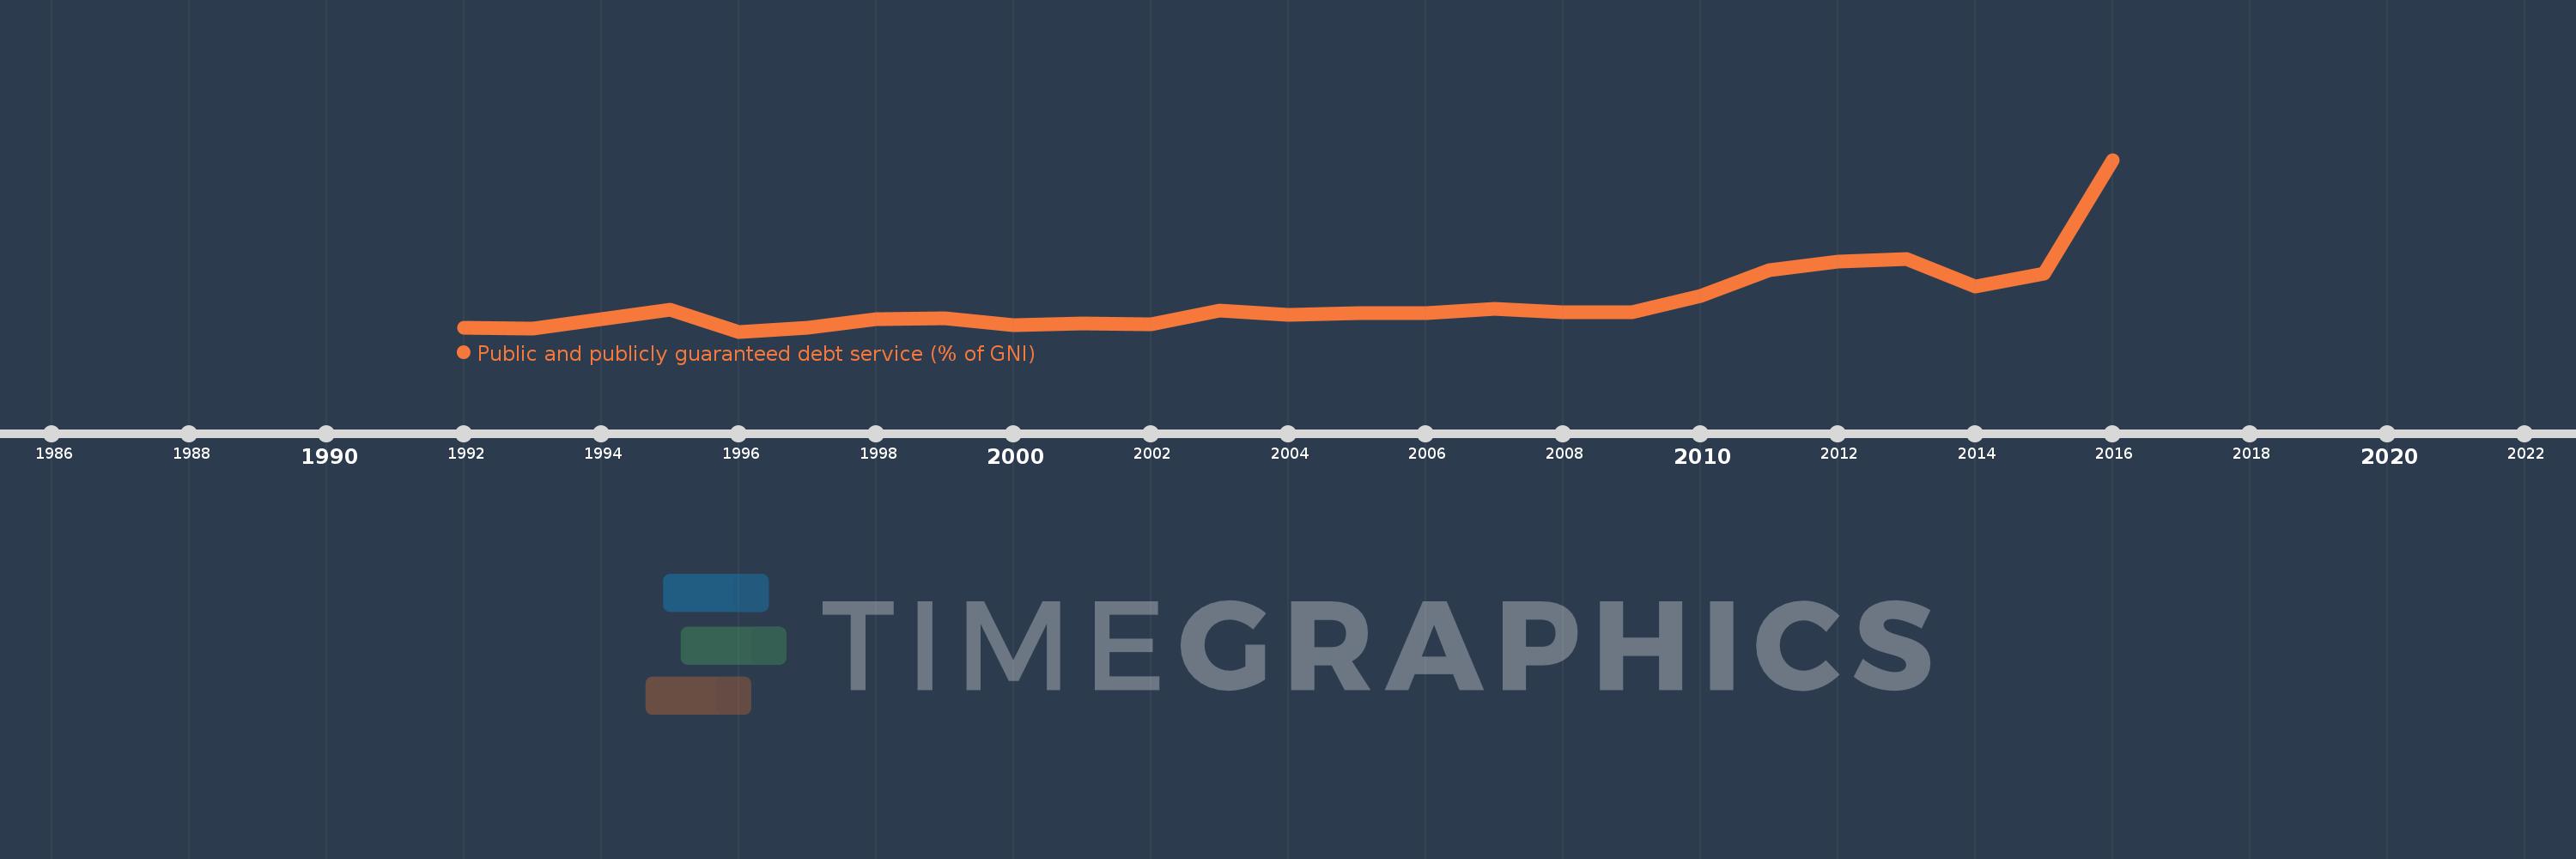
Public and publicly guaranteed debt service (% of GNI)
2016,2015,2014,2013,2012,2011,2010,2009,2008,2007,2006,2005,2004,2003,2002,2001,2000,1999,1998,1997,1996,1995,1994,1993,1992
Estas estatísticas em outros países:
Linha do tempo:
Nesta escala de tempo está apresentado um gráfico de 1992 ano até 2016 ano Albania. Dados de 1991 ano ausente. O número de observações reais por data: 25.
Fonte (nome):
Indicadores de desenvolvimento mundial
Fonte (organização):
World Bank, International Debt Statistics.
Categorias:
External Debt
Foi atualizado:
23 abr 2017 ano
Indicadores de alterações dos valores ao longo dos anos
Mínimo:
0.201
1 jan 1996 ano
Máximo:
5.357
1 jan 2016 ano
Na data de observação
Valor
Mudança absoluta
A alteração em relação ao valor anterior
1 jan 1992 ano
0.319
+0.319
0.0%
1 jan 1993 ano
0.282
-0.038
-11.75%
1 jan 1994 ano
0.586
+0.305
108.1%
1 jan 1995 ano
0.864
+0.278
47.35%
1 jan 1996 ano
0.201
-0.663
-76.78%
1 jan 1997 ano
0.317
+0.116
57.95%
1 jan 1998 ano
0.567
+0.25
78.84%
1 jan 1999 ano
0.6
+0.033
5.83%
1 jan 2000 ano
0.397
-0.203
-33.86%
1 jan 2001 ano
0.442
+0.045
11.31%
1 jan 2002 ano
0.43
-0.012
-2.62%
1 jan 2003 ano
0.823
+0.393
91.28%
1 jan 2004 ano
0.699
-0.124
-15.03%
1 jan 2005 ano
0.768
+0.069
9.87%
1 jan 2006 ano
0.761
-0.007
-0.92%
1 jan 2007 ano
0.886
+0.125
16.39%
1 jan 2008 ano
0.787
-0.098
-11.1%
1 jan 2009 ano
0.785
-0.002
-0.24%
1 jan 2010 ano
1.278
+0.493
62.74%
1 jan 2011 ano
2.038
+0.76
59.45%
1 jan 2012 ano
2.303
+0.265
13.0%
1 jan 2013 ano
2.375
+0.073
3.15%
1 jan 2014 ano
1.549
-0.826
-34.78%
1 jan 2015 ano
1.941
+0.391
25.27%
1 jan 2016 ano
5.357
+3.416
176.0%
Classificação de países por estatísticas atuais por anos


Comentários: