29
/pt/
pt
AIzaSyAYiBZKx7MnpbEhh9jyipgxe19OcubqV5w
April 1, 2024
35332
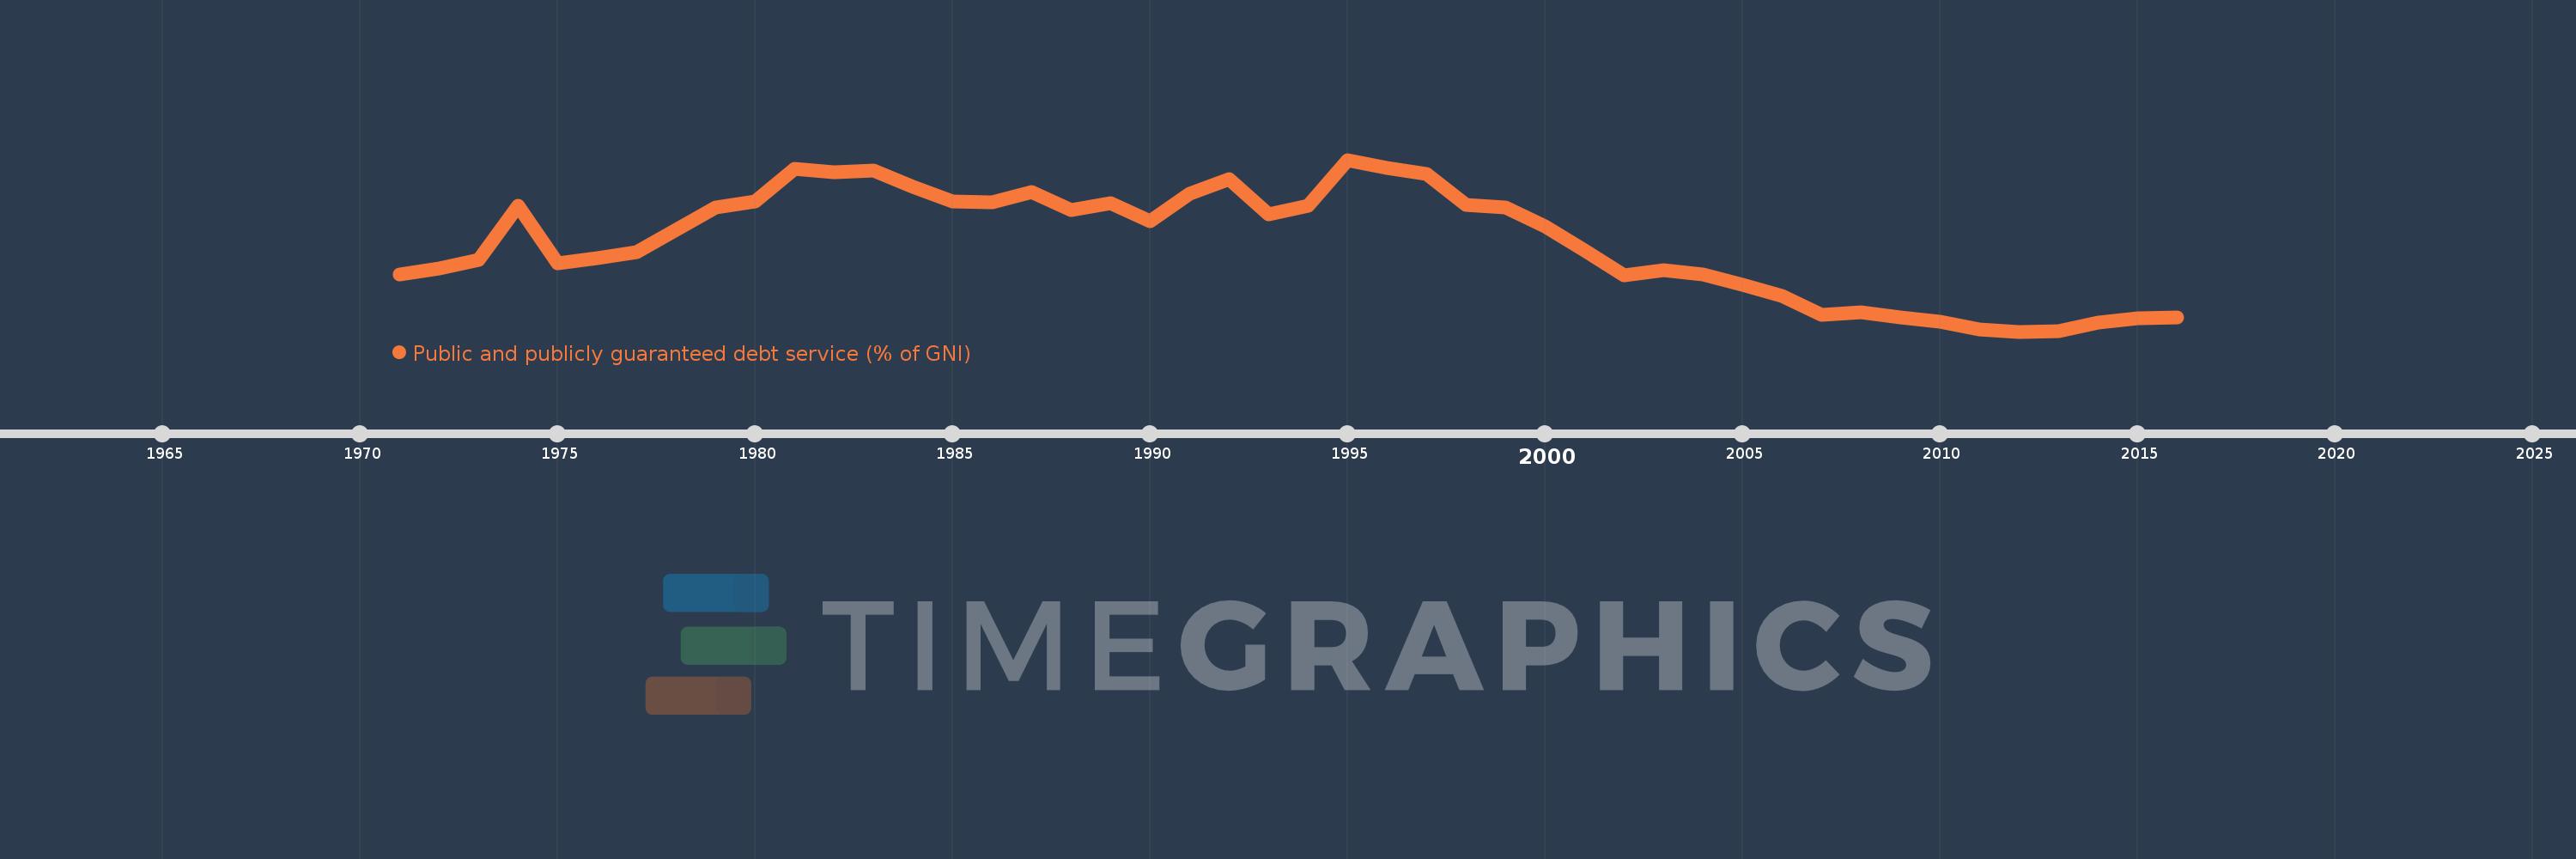
Heavily indebted poor countries (HIPC)
HPC
false
2
1
Public and publicly guaranteed debt service (% of GNI)
2016,2015,2014,2013,2012,2011,2010,2009,2008,2007,2006,2005,2004,2003,2002,2001,2000,1999,1998,1997,1996,1995,1994,1993,1992,1991,1990,1989,1988,1987,1986,1985,1984,1983,1982,1981,1980,1979,1978,1977,1976,1975,1974,1973,1972,1971
Estas estatísticas em outros países:
Linha do tempo:
Nesta escala de tempo está apresentado um gráfico de 1971 ano até 2016 ano Heavily indebted poor countries (HIPC). Dados de 1970 ano ausente. O número de observações reais por data: 46.
Fonte (nome):
Indicadores de desenvolvimento mundial
Fonte (organização):
World Bank, International Debt Statistics.
Categorias:
External Debt
Foi atualizado:
23 abr 2017 ano
Indicadores de alterações dos valores ao longo dos anos
Mínimo:
0.79
1 jan 2012 ano
Máximo:
4.399
1 jan 1995 ano
Na data de observação
Valor
Mudança absoluta
A alteração em relação ao valor anterior
1 jan 1971 ano
1.988
+1.988
0.0%
1 jan 1972 ano
2.116
+0.128
6.42%
1 jan 1973 ano
2.297
+0.182
8.59%
1 jan 1974 ano
3.425
+1.128
49.09%
1 jan 1975 ano
2.23
-1.196
-34.91%
1 jan 1976 ano
2.34
+0.11
4.95%
1 jan 1977 ano
2.452
+0.112
4.79%
1 jan 1978 ano
2.93
+0.478
19.48%
1 jan 1979 ano
3.398
+0.468
15.99%
1 jan 1980 ano
3.528
+0.13
3.83%
1 jan 1981 ano
4.212
+0.684
19.38%
1 jan 1982 ano
4.146
-0.067
-1.58%
1 jan 1983 ano
4.167
+0.021
0.51%
1 jan 1984 ano
3.827
-0.341
-8.17%
1 jan 1985 ano
3.531
-0.296
-7.73%
1 jan 1986 ano
3.504
-0.027
-0.76%
1 jan 1987 ano
3.723
+0.219
6.25%
1 jan 1988 ano
3.35
-0.373
-10.01%
1 jan 1989 ano
3.492
+0.141
4.22%
1 jan 1990 ano
3.104
-0.388
-11.11%
1 jan 1991 ano
3.687
+0.583
18.78%
1 jan 1992 ano
3.993
+0.306
8.31%
1 jan 1993 ano
3.262
-0.731
-18.3%
1 jan 1994 ano
3.434
+0.172
5.26%
1 jan 1995 ano
4.399
+0.966
28.12%
1 jan 1996 ano
4.227
-0.172
-3.91%
1 jan 1997 ano
4.095
-0.133
-3.14%
1 jan 1998 ano
3.451
-0.644
-15.73%
1 jan 1999 ano
3.398
-0.052
-1.52%
1 jan 2000 ano
3.0
-0.398
-11.72%
1 jan 2001 ano
2.497
-0.503
-16.77%
1 jan 2002 ano
1.974
-0.523
-20.94%
1 jan 2003 ano
2.088
+0.114
5.78%
1 jan 2004 ano
1.982
-0.106
-5.06%
1 jan 2005 ano
1.782
-0.2
-10.09%
1 jan 2006 ano
1.542
-0.24
-13.47%
1 jan 2007 ano
1.133
-0.409
-26.53%
1 jan 2008 ano
1.192
+0.059
5.18%
1 jan 2009 ano
1.081
-0.111
-9.27%
1 jan 2010 ano
0.999
-0.082
-7.62%
1 jan 2011 ano
0.834
-0.165
-16.51%
1 jan 2012 ano
0.79
-0.044
-5.24%
1 jan 2013 ano
0.801
+0.011
1.37%
1 jan 2014 ano
0.988
+0.187
23.38%
1 jan 2015 ano
1.073
+0.084
8.53%
1 jan 2016 ano
1.088
+0.015
1.39%
Classificação de países por estatísticas atuais por anos


Comentários: