30
/
AIzaSyAYiBZKx7MnpbEhh9jyipgxe19OcubqV5w
April 1, 2024
99390
Cambodia
KHM
true
2
1
Trademark applications, total
2015,2014,2013,2012,2011,2010,2009,2008,2007,2006,2005,2004,2003,2002,2001,2000,1999,1998,1997,1996,1995,1974,1973,1972,1971
Download
Global statistics library →Cambodia →

Trademark applications, total

This statistics in other country:

AlbaniaAlgeriaAndorraAngolaAntigua and BarbudaArab WorldArgentinaArmeniaArubaAustraliaAustriaAzerbaijanBahamas, TheBahrainBangladeshBarbadosBelarusBelgiumBelizeBhutanBoliviaBosnia and HerzegovinaBotswanaBrazilBrunei DarussalamBulgariaBurkina FasoBurundiCabo VerdeCambodiaCanadaCaribbean small statesCentral Europe and the BalticsChileChinaColombiaComorosCongo, Dem. Rep.Costa RicaCroatiaCubaCuracaoCyprusCzech RepublicDenmarkDjiboutiDominicaDominican RepublicEarly-demographic dividendEast Asia & PacificEast Asia & Pacific (excluding high income)East Asia & Pacific (IDA & IBRD countries)EcuadorEgypt, Arab Rep.El SalvadorEquatorial GuineaEstoniaEthiopiaEuro areaEurope & Central AsiaEurope & Central Asia (excluding high income)Europe & Central Asia (IDA & IBRD countries)European UnionFijiFinlandFranceGambia, TheGeorgiaGermanyGhanaGreeceGrenadaGuatemalaGuineaGuinea-BissauGuyanaHaitiHigh incomeHondurasHong Kong SAR, ChinaHungaryIBRD onlyIcelandIDA & IBRD totalIDA blendIDA onlyIDA totalIndiaIndonesiaIran, Islamic Rep.IraqIrelandIsraelItalyJamaicaJapanJordanKazakhstanKenyaKiribatiKorea, Dem. People’s Rep.Korea, Rep.KuwaitKyrgyz RepublicLao PDRLate-demographic dividendLatin America & Caribbean Latin America & Caribbean (excluding high income)Latin America & the Caribbean (IDA & IBRD countries)LatviaLeast developed countries: UN classificationLebanonLesothoLiberiaLibyaLiechtensteinLithuaniaLow & middle incomeLower middle incomeLuxembourgMacao SAR, ChinaMacedonia, FYRMadagascarMalawiMalaysiaMaldivesMaliMaltaMauritiusMexicoMiddle East & North AfricaMiddle East & North Africa (excluding high income)Middle East & North Africa (IDA & IBRD countries)Middle incomeMoldovaMonacoMongoliaMontenegroMoroccoMozambiqueMyanmarNamibiaNepalNetherlandsNew ZealandNicaraguaNigeriaNorth AmericaNorwayOECD membersOmanOther small statesPacific island small statesPakistanPanamaPapua New GuineaParaguayPeruPhilippinesPolandPortugalPost-demographic dividendQatarRomaniaRussian FederationRwandaSamoaSan MarinoSao Tome and PrincipeSaudi ArabiaSerbiaSeychellesSierra LeoneSingaporeSint Maarten (Dutch part)Slovak RepublicSloveniaSmall statesSolomon IslandsSomaliaSouth AfricaSouth AsiaSouth Asia (IDA & IBRD)SpainSri LankaSt. LuciaSt. Vincent and the GrenadinesSudanSurinameSwazilandSwedenSwitzerlandSyrian Arab RepublicTajikistanTanzaniaThailandTongaTrinidad and TobagoTunisiaTurkeyTurkmenistanTuvaluUgandaUkraineUnited Arab EmiratesUnited KingdomUnited StatesUpper middle incomeUruguayUzbekistanVenezuela, RBVietnamWorldYemen, Rep.ZambiaZimbabwe

Timeline:

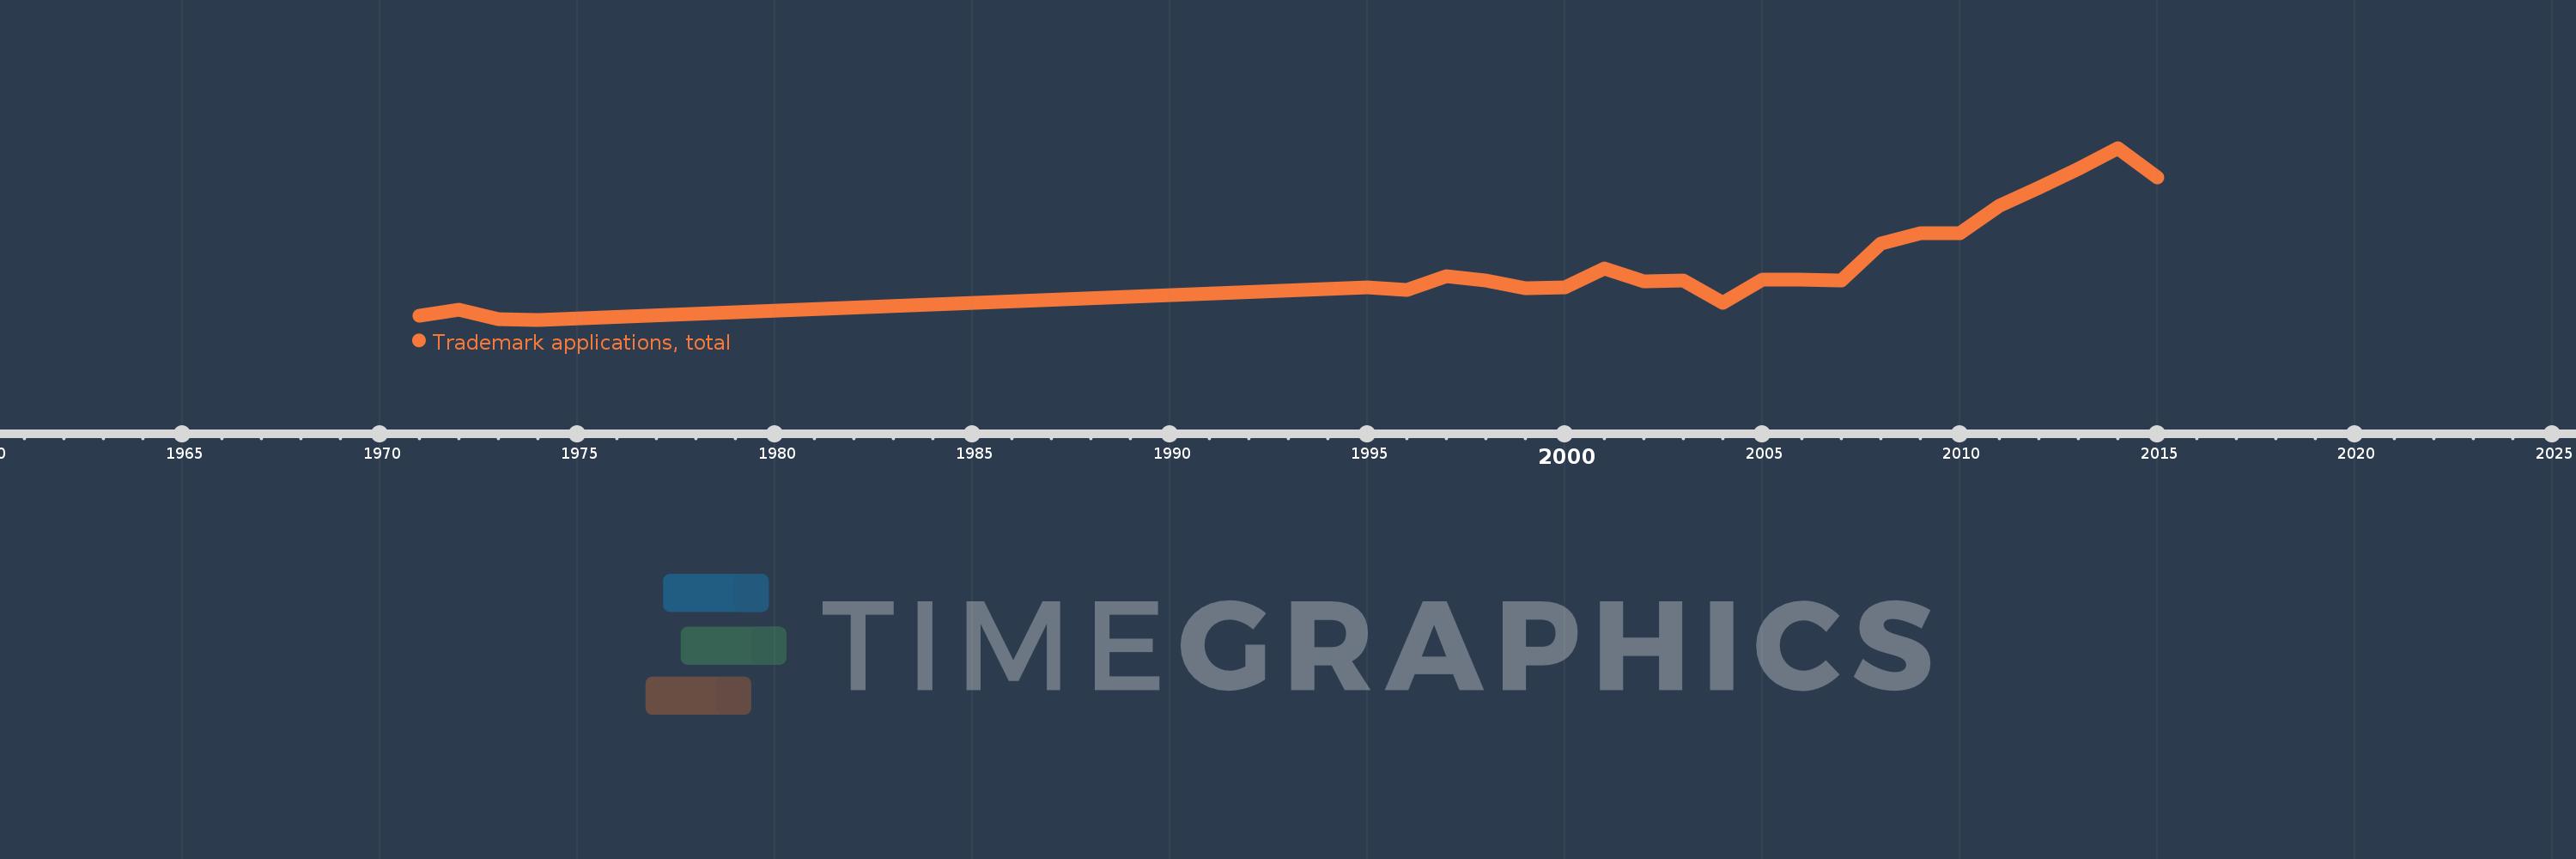
This timeline shows a graph from 1971 to 2015 of Cambodia. No data until 1970. Number of actual observations by date: 25.

Source name:

World Development Indicators

Source organization:

World Intellectual Property Organization (WIPO), World Intellectual Property Indicators and www.wipo.int/econ_stat. The International Bureau of WIPO assumes no responsibility with respect to the transformation of these data.

Categories, topics:

Science & Technology

Last updated:

apr 23, 2017

Indicators value changes by year

Meaning:
2.164K
Minimum:
287.0
jan 1, 1974
Maximum:
5.854K
jan 1, 2014
At the date of observation
Value
Absolute change
Change from the previous value
jan 1, 1971
423.0
+423.0
0.0%
jan 1, 1972
622.0
+199.0
47.04%
jan 1, 1973
316.0
-306.0
-49.2%
jan 1, 1974
287.0
-29.0
-9.18%
jan 1, 1995
1.337K
+1.05K
365.85%
jan 1, 1996
1.265K
-72.0
-5.39%
jan 1, 1997
1.708K
+443.0
35.02%
jan 1, 1998
1.549K
-159.0
-9.31%
jan 1, 1999
1.3K
-249.0
-16.07%
jan 1, 2000
1.343K
+43.0
3.31%
jan 1, 2001
1.939K
+596.0
44.38%
jan 1, 2002
1.519K
-420.0
-21.66%
jan 1, 2003
1.569K
+50.0
3.29%
jan 1, 2004
827.0
-742.0
-47.29%
jan 1, 2005
1.577K
+750.0
90.69%
jan 1, 2006
1.581K
+4.0
0.25%
jan 1, 2007
1.564K
-17.0
-1.08%
jan 1, 2008
2.758K
+1.194K
76.34%
jan 1, 2009
3.099K
+341.0
12.36%
jan 1, 2010
3.077K
-22.0
-0.71%
jan 1, 2011
3.969K
+892.0
28.99%
jan 1, 2012
4.567K
+598.0
15.07%
jan 1, 2013
5.168K
+601.0
13.16%
jan 1, 2014
5.854K
+686.0
13.27%
jan 1, 2015
4.888K
-966.0
-16.5%

Ranking of countries by current statistics by years