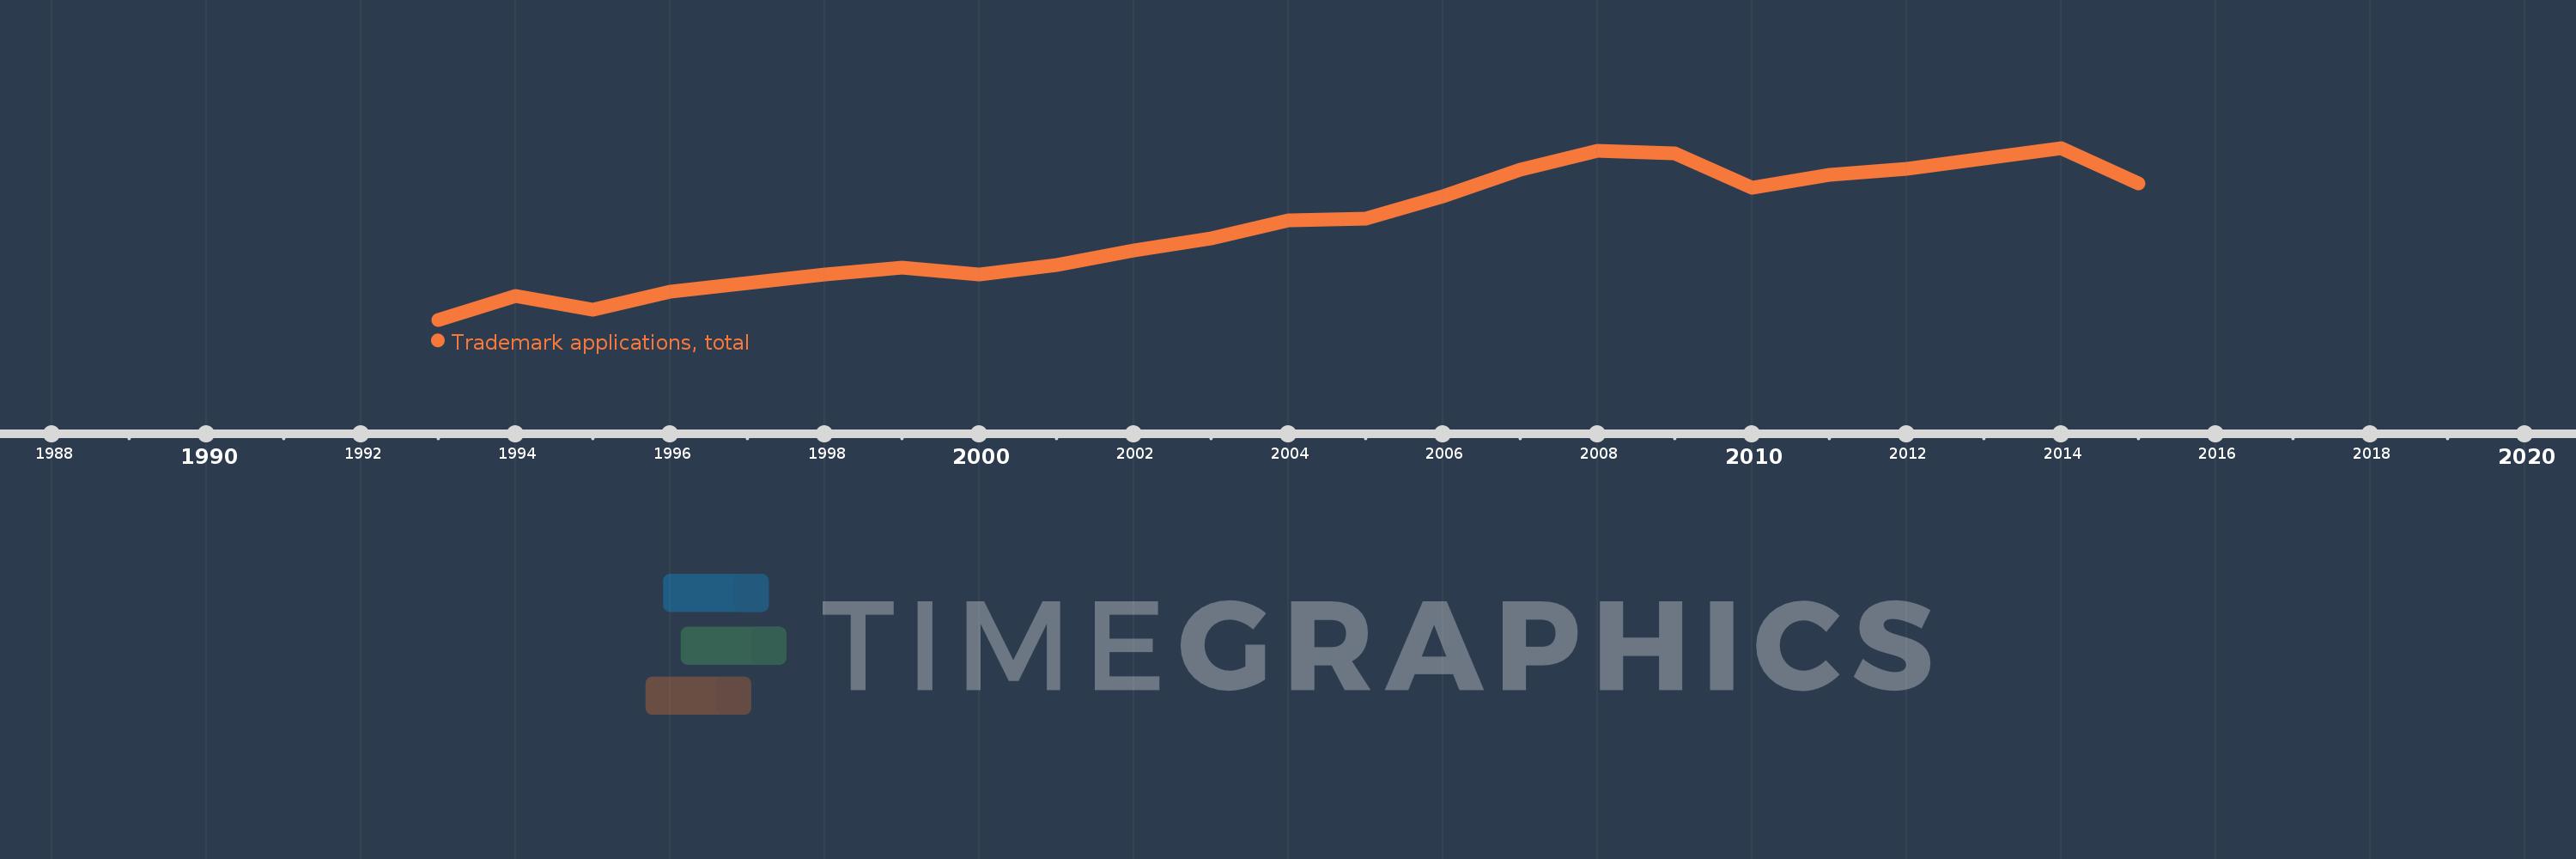
This timeline shows a graph from 1993 to 2015 of Ukraine. No data until 1992. Number of actual observations by date: 23.
Source name:
World Development Indicators
Source organization:
World Intellectual Property Organization (WIPO), World Intellectual Property Indicators and www.wipo.int/econ_stat. The International Bureau of WIPO assumes no responsibility with respect to the transformation of these data.
Categories, topics:
Science & Technology
Last updated:
apr 23, 2017
Indicators value changes by year
Meaning:
18.926K
Minimum:
759.0
jan 1, 1993
Maximum:
34.082K
jan 1, 2014
At the date of observation
Value
Absolute change
Change from the previous value
jan 1, 1993
759.0
+759.0
0.0%
jan 1, 1994
5.381K
+4.622K
608.96%
jan 1, 1995
2.707K
-2.674K
-49.69%
jan 1, 1996
6.277K
+3.57K
131.88%
jan 1, 1997
7.903K
+1.626K
25.9%
jan 1, 1998
9.585K
+1.682K
21.28%
jan 1, 1999
10.819K
+1.234K
12.87%
jan 1, 2000
9.583K
-1.236K
-11.42%
jan 1, 2001
11.316K
+1.733K
18.08%
jan 1, 2002
14.174K
+2.858K
25.26%
jan 1, 2003
16.607K
+2.433K
17.17%
jan 1, 2004
20.048K
+3.441K
20.72%
jan 1, 2005
20.33K
+282.0
1.41%
jan 1, 2006
24.653K
+4.323K
21.26%
jan 1, 2007
29.885K
+5.232K
21.22%
jan 1, 2008
33.512K
+3.627K
12.14%
jan 1, 2009
33.019K
-493.0
-1.47%
jan 1, 2010
26.434K
-6.585K
-19.94%
jan 1, 2011
28.915K
+2.481K
9.39%
jan 1, 2012
30.001K
+1.086K
3.76%
jan 1, 2013
32.07K
+2.069K
6.9%
jan 1, 2014
34.082K
+2.012K
6.27%
jan 1, 2015
27.242K
-6.84K
-20.07%
Ranking of countries by current statistics by years