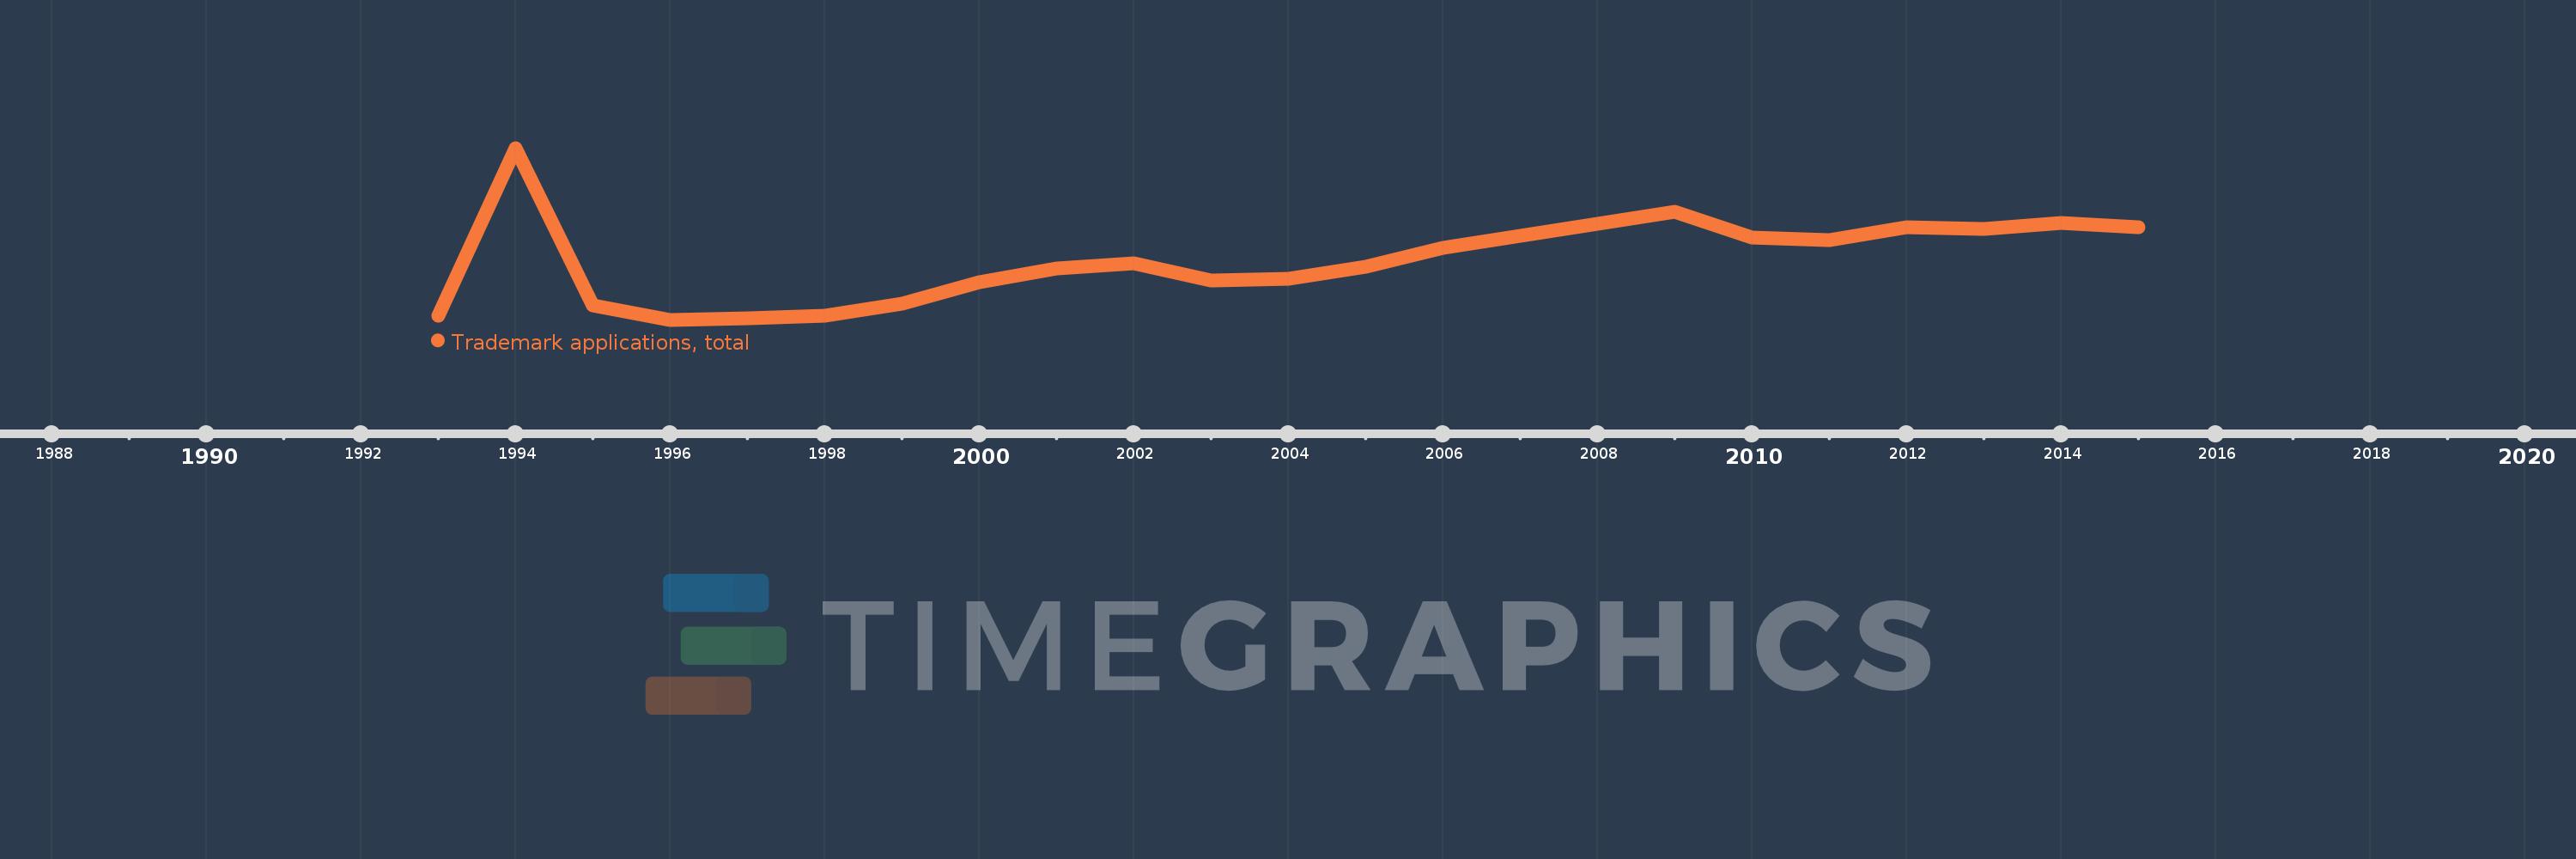
This timeline shows a graph from 1993 to 2015 of Georgia. No data until 1992. Number of actual observations by date: 23.
Source name:
World Development Indicators
Source organization:
World Intellectual Property Organization (WIPO), World Intellectual Property Indicators and www.wipo.int/econ_stat. The International Bureau of WIPO assumes no responsibility with respect to the transformation of these data.
Categories, topics:
Science & Technology
Last updated:
apr 23, 2017
Indicators value changes by year
Meaning:
3.497K
Minimum:
1.037K
jan 1, 1996
Maximum:
8.058K
jan 1, 1994
At the date of observation
Value
Absolute change
Change from the previous value
jan 1, 1993
1.217K
+1.217K
0.0%
jan 1, 1994
8.058K
+6.841K
562.12%
jan 1, 1995
1.61K
-6.448K
-80.02%
jan 1, 1996
1.037K
-573.0
-35.59%
jan 1, 1997
1.088K
+51.0
4.92%
jan 1, 1998
1.2K
+112.0
10.29%
jan 1, 1999
1.682K
+482.0
40.17%
jan 1, 2000
2.574K
+892.0
53.03%
jan 1, 2001
3.15K
+576.0
22.38%
jan 1, 2002
3.332K
+182.0
5.78%
jan 1, 2003
2.64K
-692.0
-20.77%
jan 1, 2004
2.722K
+82.0
3.11%
jan 1, 2005
3.202K
+480.0
17.63%
jan 1, 2006
3.986K
+784.0
24.48%
jan 1, 2007
4.467K
+481.0
12.07%
jan 1, 2008
4.966K
+499.0
11.17%
jan 1, 2009
5.441K
+475.0
9.57%
jan 1, 2010
4.382K
-1.059K
-19.46%
jan 1, 2011
4.301K
-81.0
-1.85%
jan 1, 2012
4.809K
+508.0
11.81%
jan 1, 2013
4.758K
-51.0
-1.06%
jan 1, 2014
4.987K
+229.0
4.81%
jan 1, 2015
4.826K
-161.0
-3.23%
Ranking of countries by current statistics by years