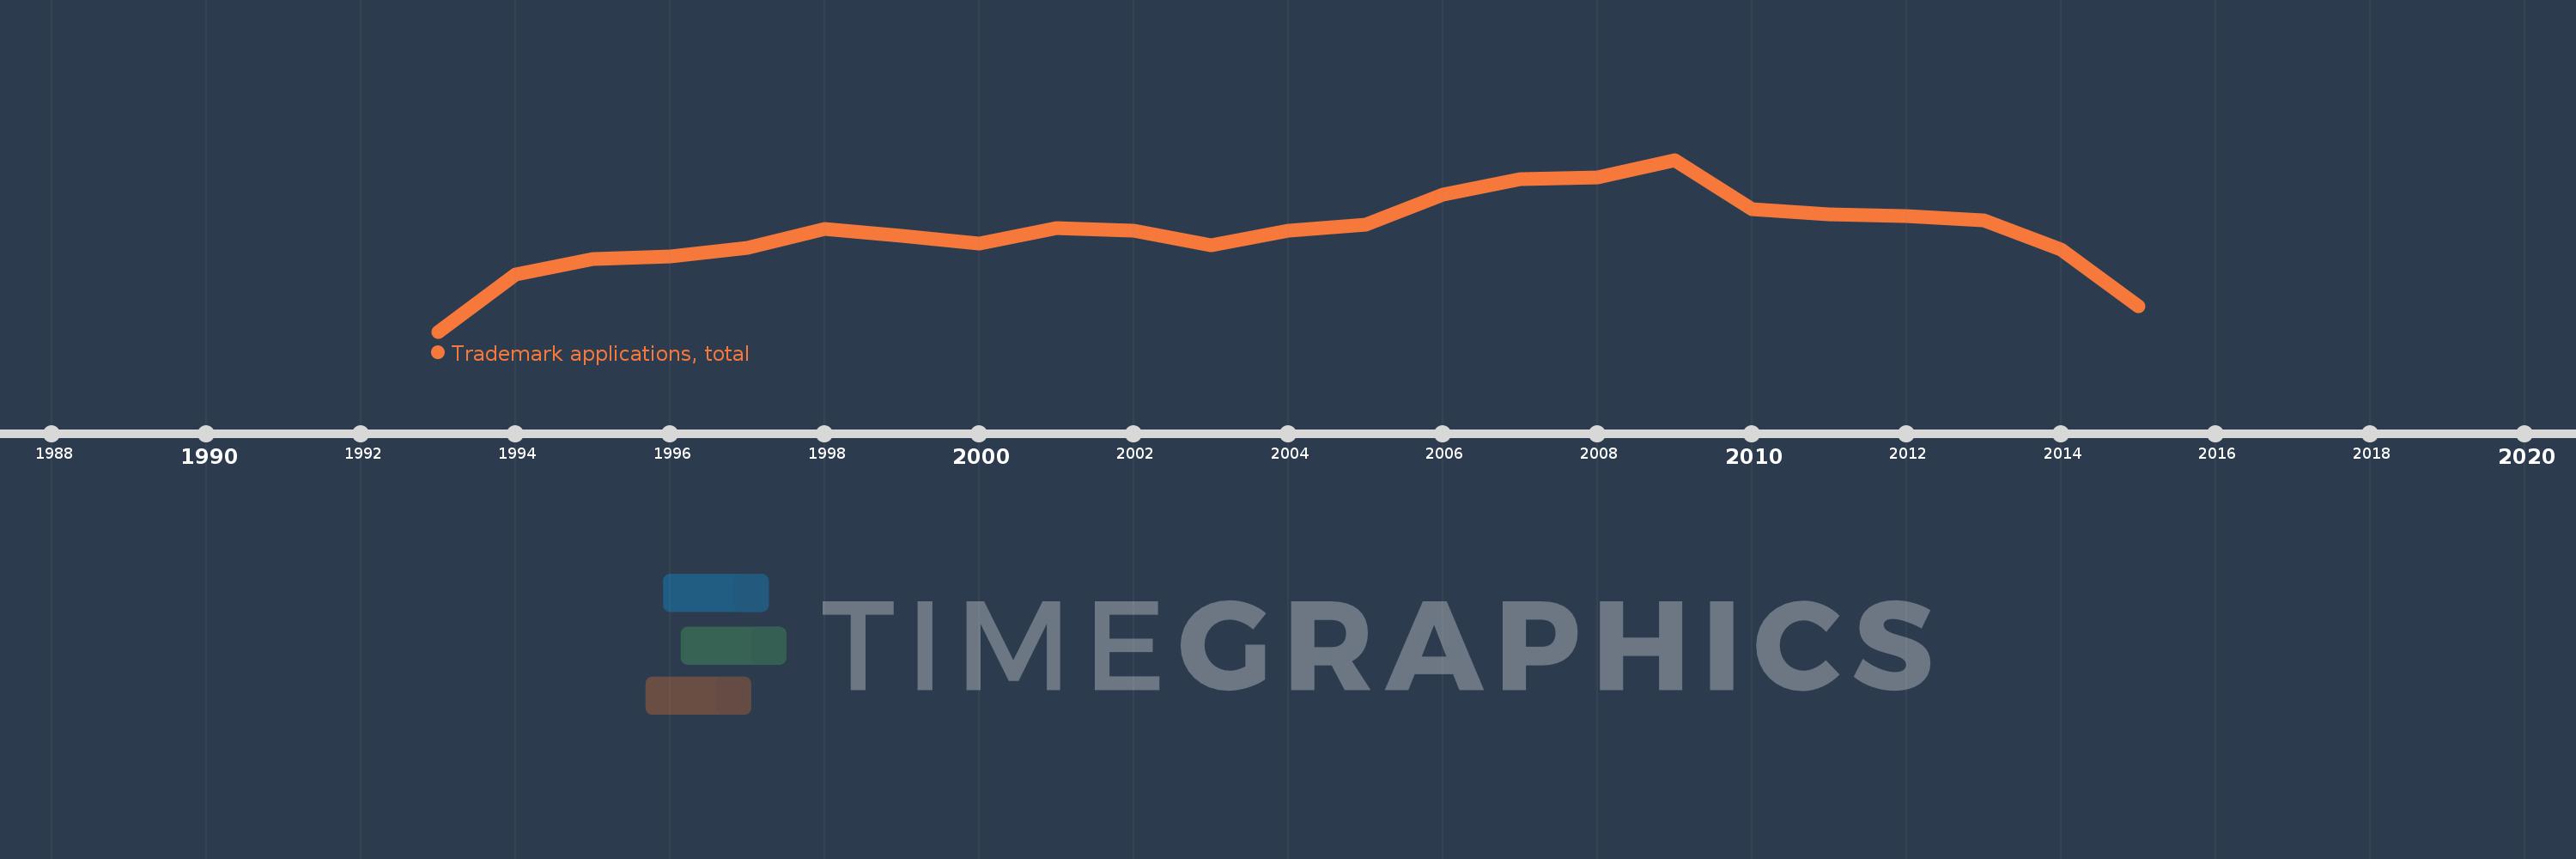
This timeline shows a graph from 1993 to 2015 of Croatia. No data until 1992. Number of actual observations by date: 23.
Source name:
World Development Indicators
Source organization:
World Intellectual Property Organization (WIPO), World Intellectual Property Indicators and www.wipo.int/econ_stat. The International Bureau of WIPO assumes no responsibility with respect to the transformation of these data.
Categories, topics:
Science & Technology
Last updated:
apr 23, 2017
Indicators value changes by year
Meaning:
6.982K
Minimum:
2.525K
jan 1, 1993
Maximum:
10.313K
jan 1, 2009
At the date of observation
Value
Absolute change
Change from the previous value
jan 1, 1993
2.525K
+2.525K
0.0%
jan 1, 1994
5.109K
+2.584K
102.34%
jan 1, 1995
5.816K
+707.0
13.84%
jan 1, 1996
5.95K
+134.0
2.3%
jan 1, 1997
6.335K
+385.0
6.47%
jan 1, 1998
7.181K
+846.0
13.35%
jan 1, 1999
6.855K
-326.0
-4.54%
jan 1, 2000
6.505K
-350.0
-5.11%
jan 1, 2001
7.205K
+700.0
10.76%
jan 1, 2002
7.103K
-102.0
-1.42%
jan 1, 2003
6.443K
-660.0
-9.29%
jan 1, 2004
7.097K
+654.0
10.15%
jan 1, 2005
7.355K
+258.0
3.64%
jan 1, 2006
8.732K
+1.377K
18.72%
jan 1, 2007
9.422K
+690.0
7.9%
jan 1, 2008
9.504K
+82.0
0.87%
jan 1, 2009
10.313K
+809.0
8.51%
jan 1, 2010
8.055K
-2.258K
-21.89%
jan 1, 2011
7.845K
-210.0
-2.61%
jan 1, 2012
7.759K
-86.0
-1.1%
jan 1, 2013
7.564K
-195.0
-2.51%
jan 1, 2014
6.239K
-1.325K
-17.52%
jan 1, 2015
3.685K
-2.554K
-40.94%
Ranking of countries by current statistics by years