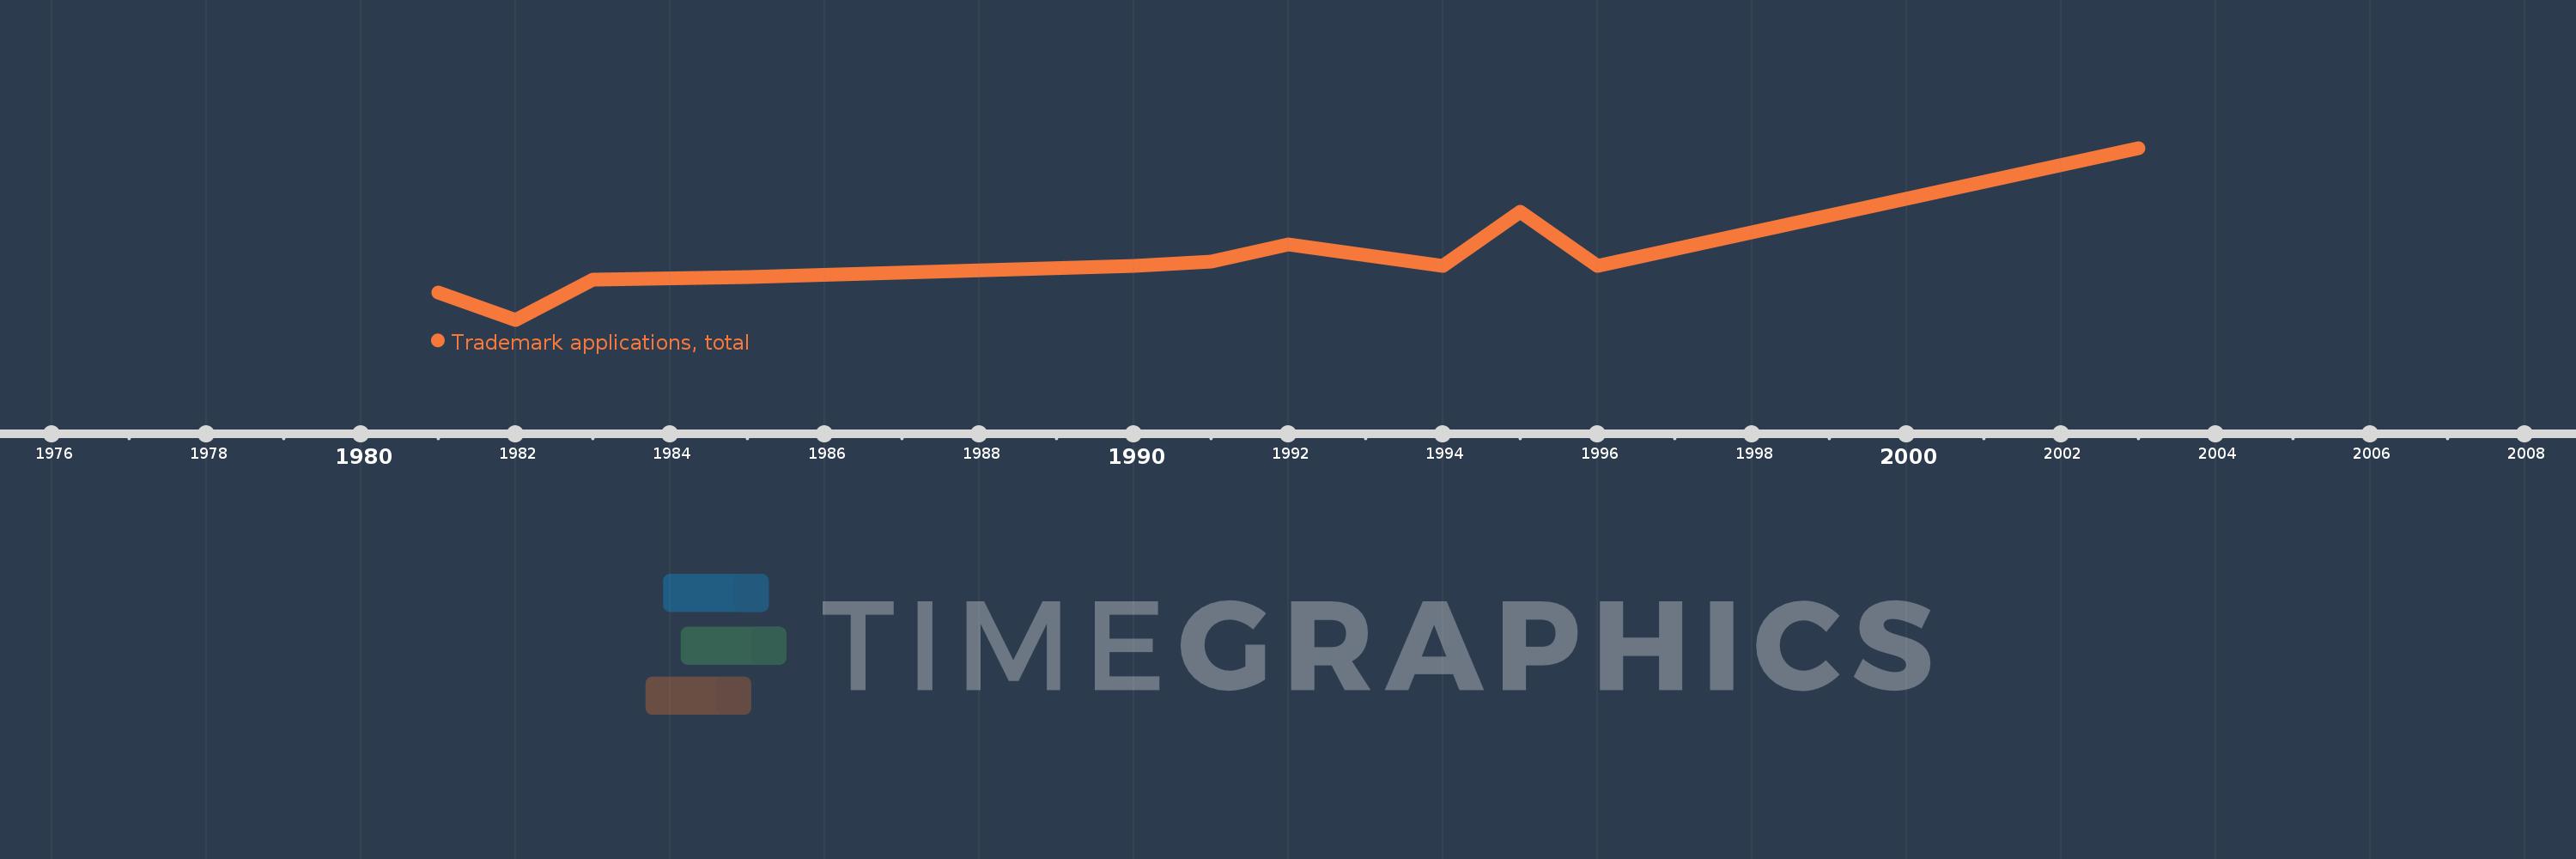
This timeline shows a graph from 1981 to 2003 of Tonga. No data until 1980. Number of actual observations by date: 11.
Source name:
World Development Indicators
Source organization:
World Intellectual Property Organization (WIPO), World Intellectual Property Indicators and www.wipo.int/econ_stat. The International Bureau of WIPO assumes no responsibility with respect to the transformation of these data.
Categories, topics:
Science & Technology
Last updated:
apr 23, 2017
Indicators value changes by year
Meaning:
49.273
Minimum:
17.0
jan 1, 1982
Maximum:
106.0
jan 1, 2003
At the date of observation
Value
Absolute change
Change from the previous value
jan 1, 1981
31.0
+31.0
0.0%
jan 1, 1982
17.0
-14.0
-45.16%
jan 1, 1983
38.0
+21.0
123.53%
jan 1, 1985
39.0
+1.0
2.63%
jan 1, 1990
45.0
+6.0
15.38%
jan 1, 1991
47.0
+2.0
4.44%
jan 1, 1992
56.0
+9.0
19.15%
jan 1, 1994
45.0
-11.0
-19.64%
jan 1, 1995
73.0
+28.0
62.22%
jan 1, 1996
45.0
-28.0
-38.36%
jan 1, 2003
106.0
+61.0
135.56%
Ranking of countries by current statistics by years