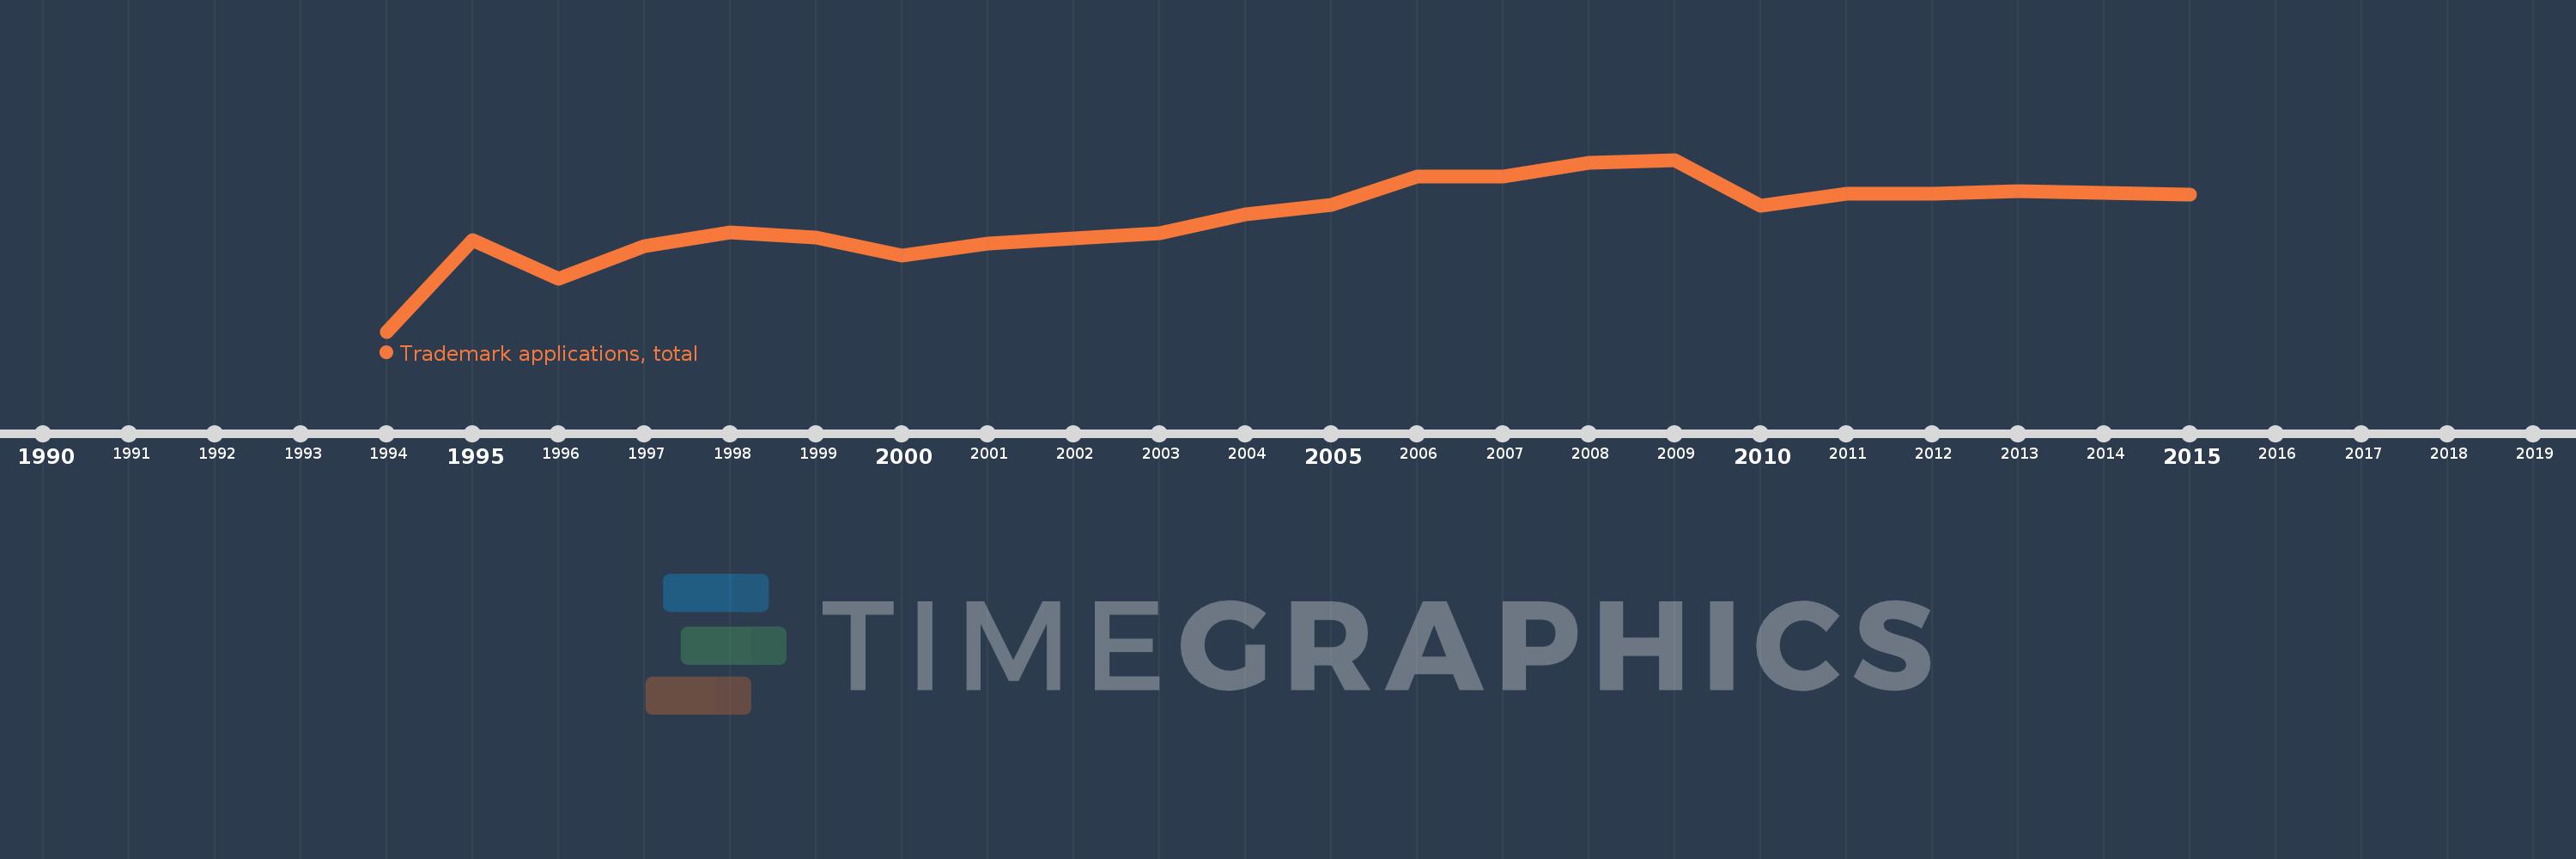
This timeline shows a graph from 1994 to 2015 of Moldova. No data until 1993. Number of actual observations by date: 22.
Source name:
World Development Indicators
Source organization:
World Intellectual Property Organization (WIPO), World Intellectual Property Indicators and www.wipo.int/econ_stat. The International Bureau of WIPO assumes no responsibility with respect to the transformation of these data.
Categories, topics:
Science & Technology
Last updated:
apr 23, 2017
Indicators value changes by year
Meaning:
4.602K
Minimum:
616.0
jan 1, 1994
Maximum:
6.662K
jan 1, 2009
At the date of observation
Value
Absolute change
Change from the previous value
jan 1, 1994
616.0
+616.0
0.0%
jan 1, 1995
3.84K
+3.224K
523.38%
jan 1, 1996
2.47K
-1.37K
-35.68%
jan 1, 1997
3.63K
+1.16K
46.96%
jan 1, 1998
4.093K
+463.0
12.75%
jan 1, 1999
3.937K
-156.0
-3.81%
jan 1, 2000
3.294K
-643.0
-16.33%
jan 1, 2001
3.7K
+406.0
12.33%
jan 1, 2002
3.909K
+209.0
5.65%
jan 1, 2003
4.081K
+172.0
4.4%
jan 1, 2004
4.738K
+657.0
16.1%
jan 1, 2005
5.086K
+348.0
7.34%
jan 1, 2006
6.08K
+994.0
19.54%
jan 1, 2007
6.072K
-8.0
-0.13%
jan 1, 2008
6.562K
+490.0
8.07%
jan 1, 2009
6.662K
+100.0
1.52%
jan 1, 2010
5.046K
-1.616K
-24.26%
jan 1, 2011
5.459K
+413.0
8.18%
jan 1, 2012
5.483K
+24.0
0.44%
jan 1, 2013
5.558K
+75.0
1.37%
jan 1, 2014
5.506K
-52.0
-0.94%
jan 1, 2015
5.428K
-78.0
-1.42%
Ranking of countries by current statistics by years