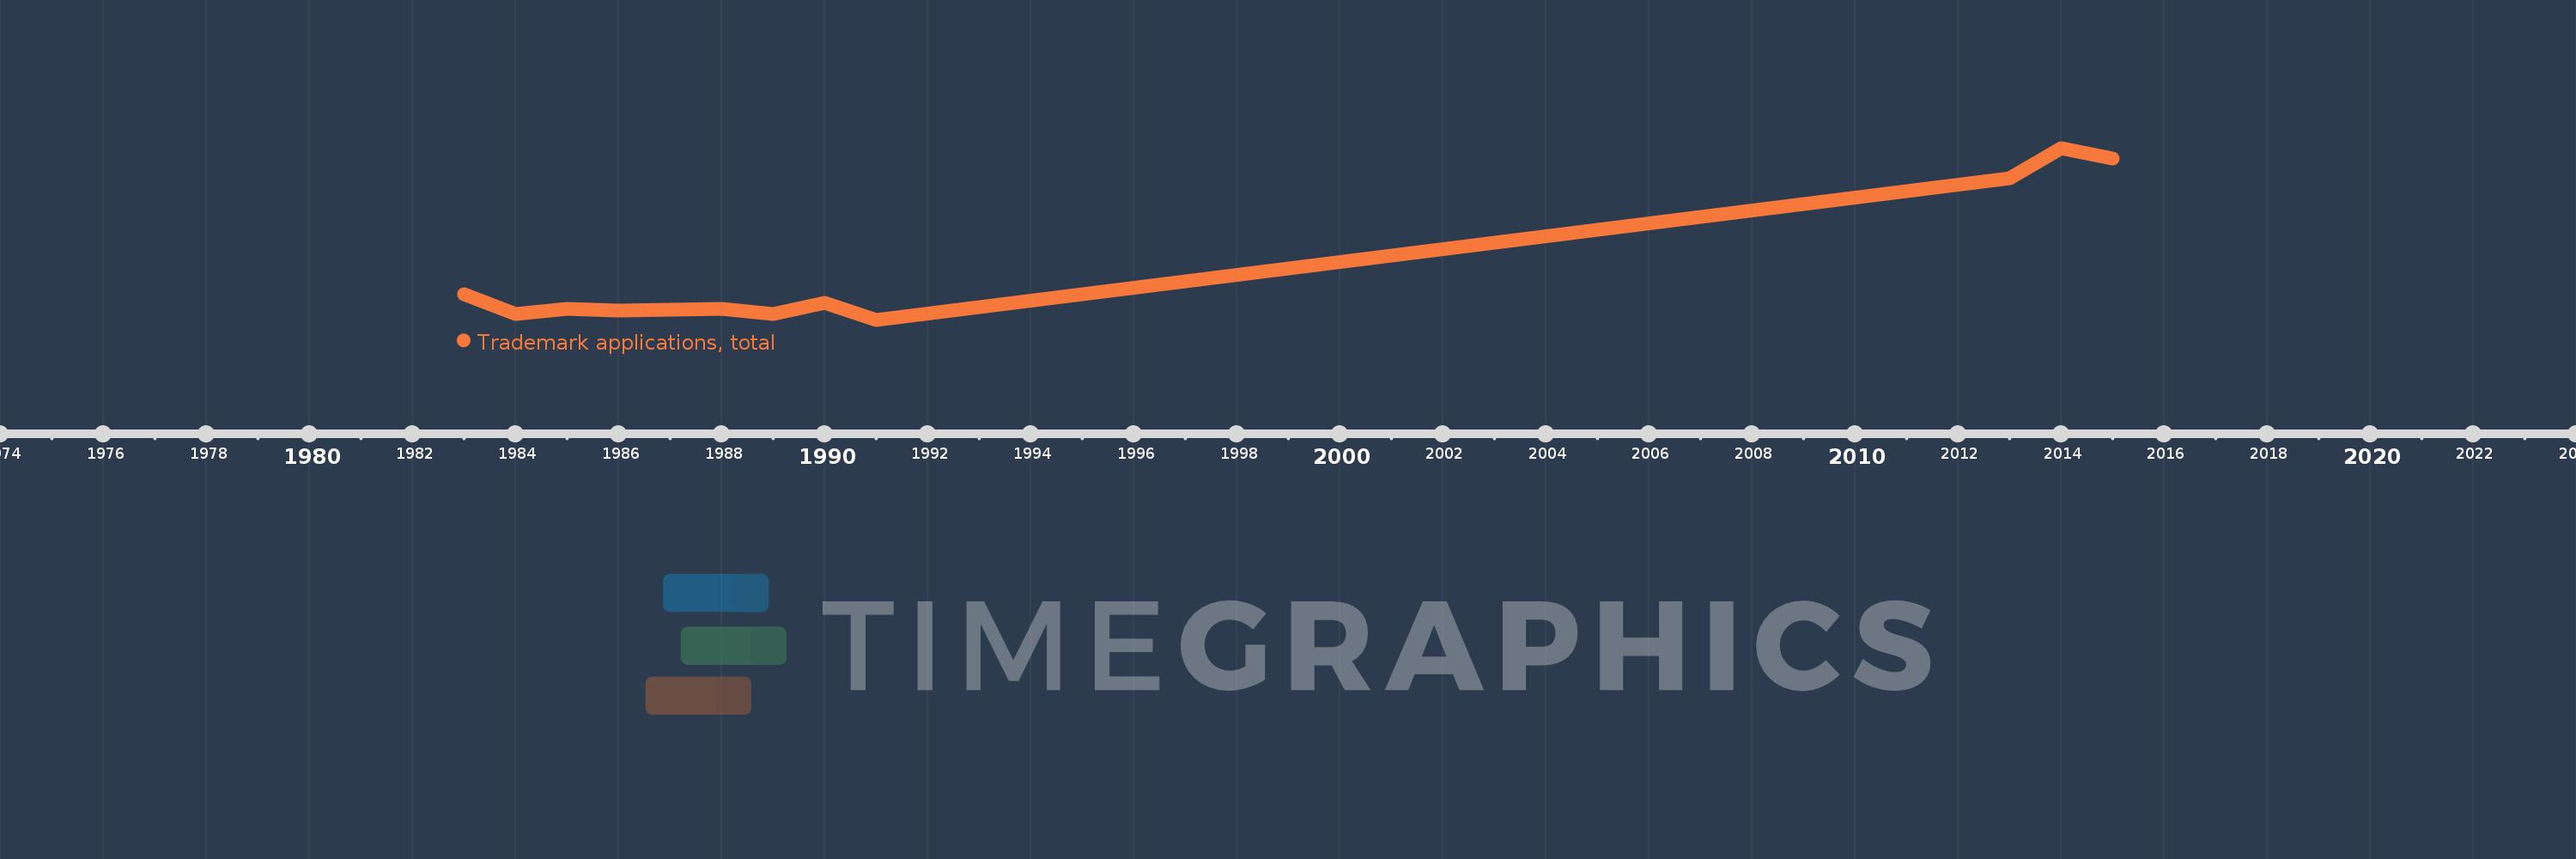
This timeline shows a graph from 1983 to 2015 of Guyana. No data until 1982. Number of actual observations by date: 11.
Source name:
World Development Indicators
Source organization:
World Intellectual Property Organization (WIPO), World Intellectual Property Indicators and www.wipo.int/econ_stat. The International Bureau of WIPO assumes no responsibility with respect to the transformation of these data.
Categories, topics:
Science & Technology
Last updated:
apr 23, 2017
Indicators value changes by year
Meaning:
333.364
Minimum:
142.0
jan 1, 1991
Maximum:
788.0
jan 1, 2014
At the date of observation
Value
Absolute change
Change from the previous value
jan 1, 1983
238.0
+238.0
0.0%
jan 1, 1984
164.0
-74.0
-31.09%
jan 1, 1985
184.0
+20.0
12.2%
jan 1, 1986
176.0
-8.0
-4.35%
jan 1, 1988
184.0
+8.0
4.55%
jan 1, 1989
163.0
-21.0
-11.41%
jan 1, 1990
207.0
+44.0
26.99%
jan 1, 1991
142.0
-65.0
-31.4%
jan 1, 2013
673.0
+531.0
373.94%
jan 1, 2014
788.0
+115.0
17.09%
jan 1, 2015
748.0
-40.0
-5.08%
Ranking of countries by current statistics by years