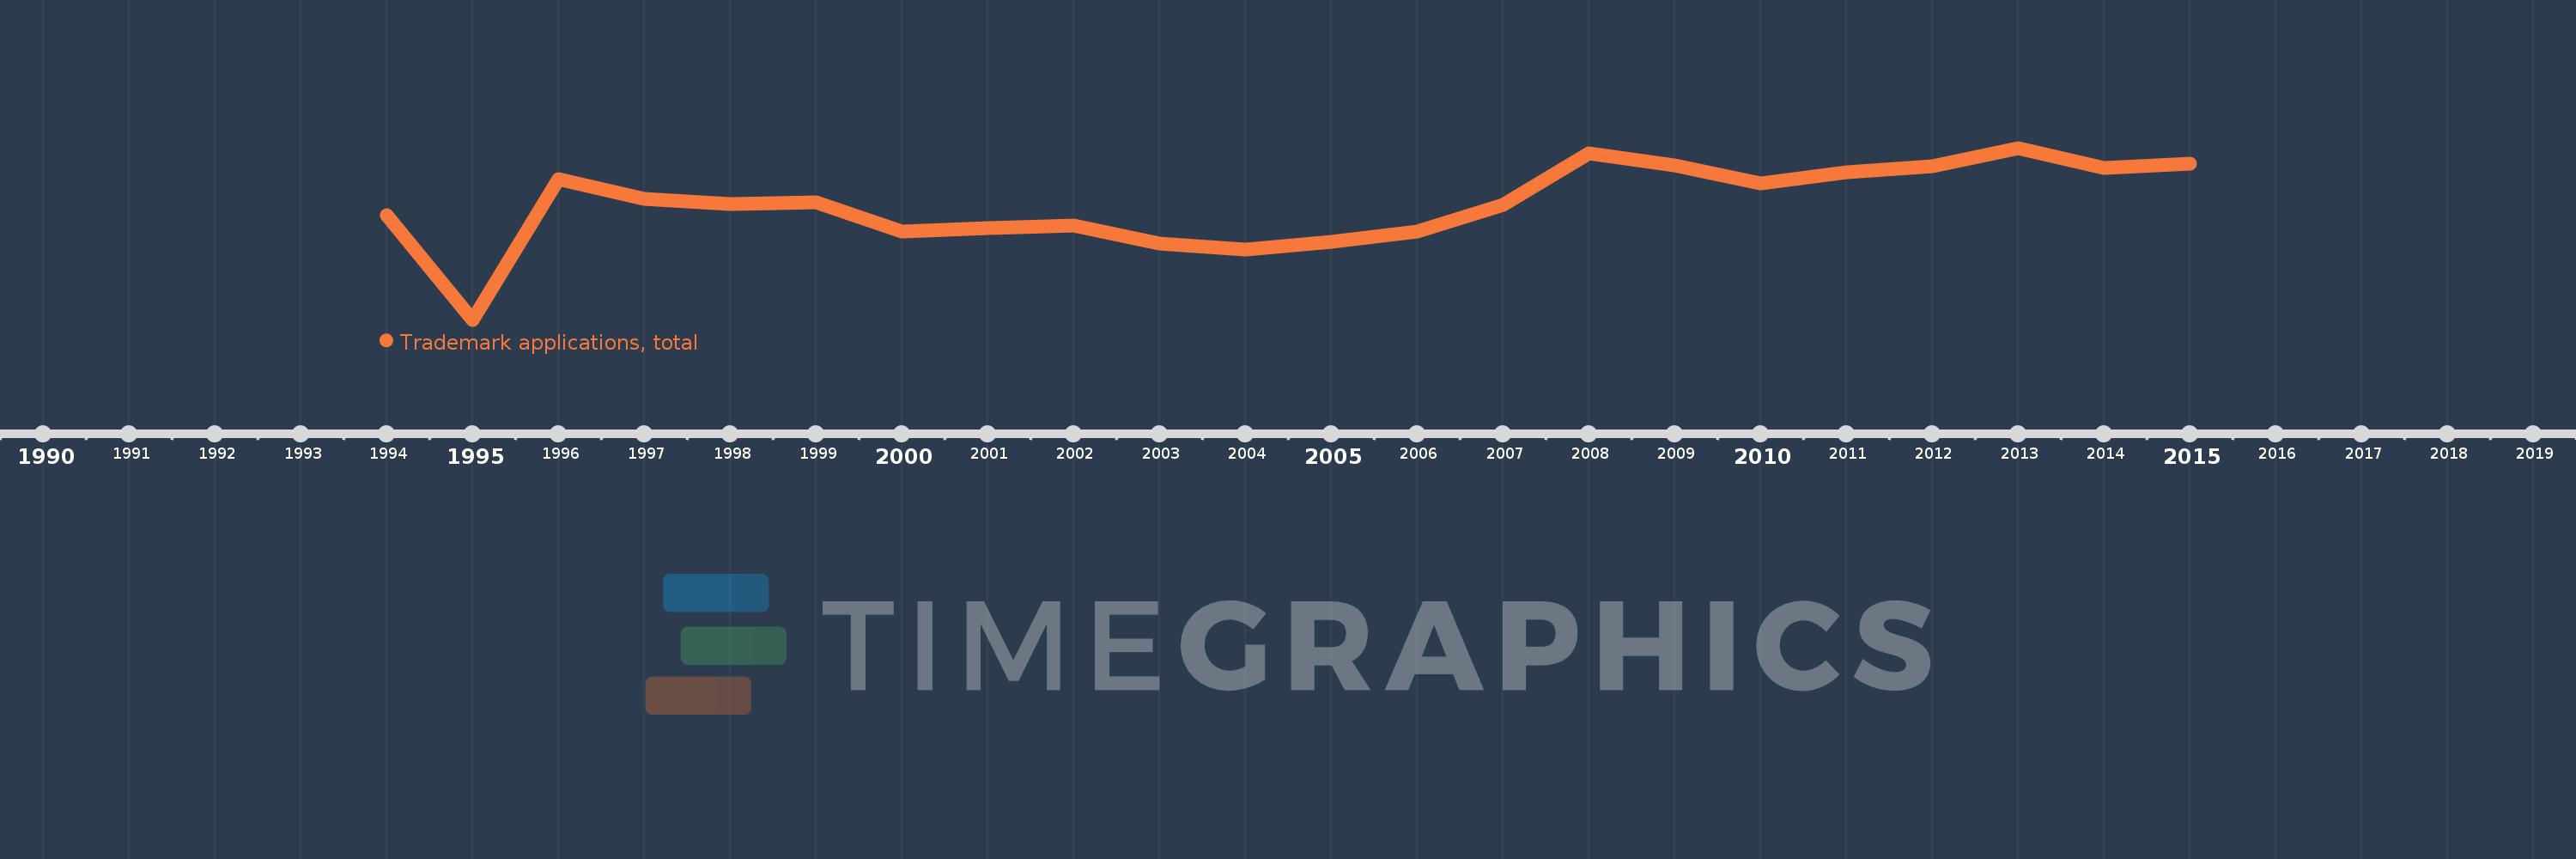
This timeline shows a graph from 1994 to 2015 of Uzbekistan. No data until 1993. Number of actual observations by date: 22.
Source name:
World Development Indicators
Source organization:
World Intellectual Property Organization (WIPO), World Intellectual Property Indicators and www.wipo.int/econ_stat. The International Bureau of WIPO assumes no responsibility with respect to the transformation of these data.
Categories, topics:
Science & Technology
Last updated:
apr 23, 2017
Indicators value changes by year
Meaning:
3.974K
Minimum:
901.0
jan 1, 1995
Maximum:
5.474K
jan 1, 2013
At the date of observation
Value
Absolute change
Change from the previous value
jan 1, 1994
3.693K
+3.693K
0.0%
jan 1, 1995
901.0
-2.792K
-75.6%
jan 1, 1996
4.647K
+3.746K
415.76%
jan 1, 1997
4.128K
-519.0
-11.17%
jan 1, 1998
3.982K
-146.0
-3.54%
jan 1, 1999
4.022K
+40.0
1.0%
jan 1, 2000
3.258K
-764.0
-19.0%
jan 1, 2001
3.348K
+90.0
2.76%
jan 1, 2002
3.413K
+65.0
1.94%
jan 1, 2003
2.922K
-491.0
-14.39%
jan 1, 2004
2.769K
-153.0
-5.24%
jan 1, 2005
2.985K
+216.0
7.8%
jan 1, 2006
3.238K
+253.0
8.48%
jan 1, 2007
3.952K
+714.0
22.05%
jan 1, 2008
5.33K
+1.378K
34.87%
jan 1, 2009
5.007K
-323.0
-6.06%
jan 1, 2010
4.541K
-466.0
-9.31%
jan 1, 2011
4.838K
+297.0
6.54%
jan 1, 2012
4.991K
+153.0
3.16%
jan 1, 2013
5.474K
+483.0
9.68%
jan 1, 2014
4.931K
-543.0
-9.92%
jan 1, 2015
5.064K
+133.0
2.7%
Ranking of countries by current statistics by years