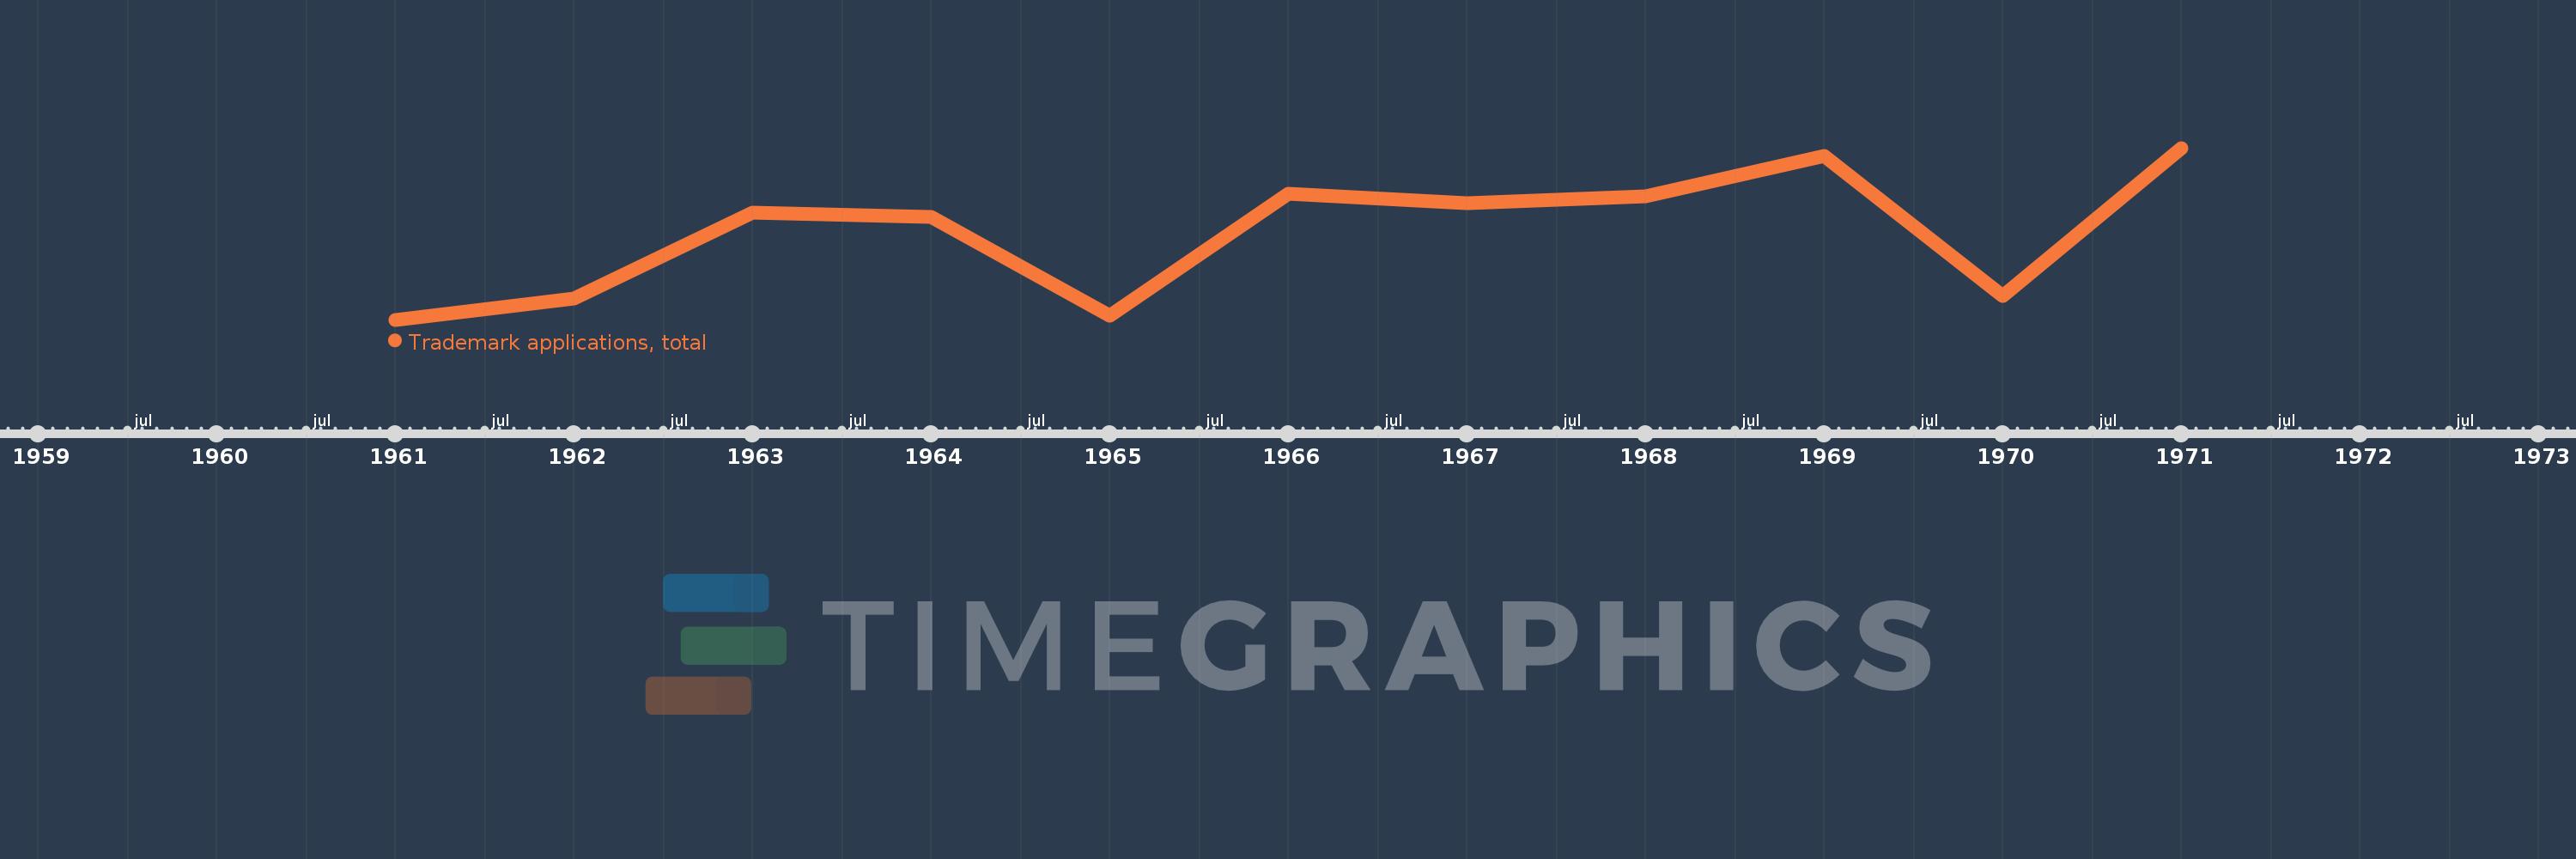
This timeline shows a graph from 1961 to 1971 of Luxembourg. No data until 1960. Number of actual observations by date: 11.
Source name:
World Development Indicators
Source organization:
World Intellectual Property Organization (WIPO), World Intellectual Property Indicators and www.wipo.int/econ_stat. The International Bureau of WIPO assumes no responsibility with respect to the transformation of these data.
Categories, topics:
Science & Technology
Last updated:
apr 23, 2017
Indicators value changes by year
Meaning:
1.078K
Minimum:
778.0
jan 1, 1961
Maximum:
1.368K
jan 1, 1971
At the date of observation
Value
Absolute change
Change from the previous value
jan 1, 1961
778.0
+778.0
0.0%
jan 1, 1962
851.0
+73.0
9.38%
jan 1, 1963
1.146K
+295.0
34.67%
jan 1, 1964
1.131K
-15.0
-1.31%
jan 1, 1965
792.0
-339.0
-29.97%
jan 1, 1966
1.21K
+418.0
52.78%
jan 1, 1967
1.179K
-31.0
-2.56%
jan 1, 1968
1.202K
+23.0
1.95%
jan 1, 1969
1.342K
+140.0
11.65%
jan 1, 1970
860.0
-482.0
-35.92%
jan 1, 1971
1.368K
+508.0
59.07%
Ranking of countries by current statistics by years