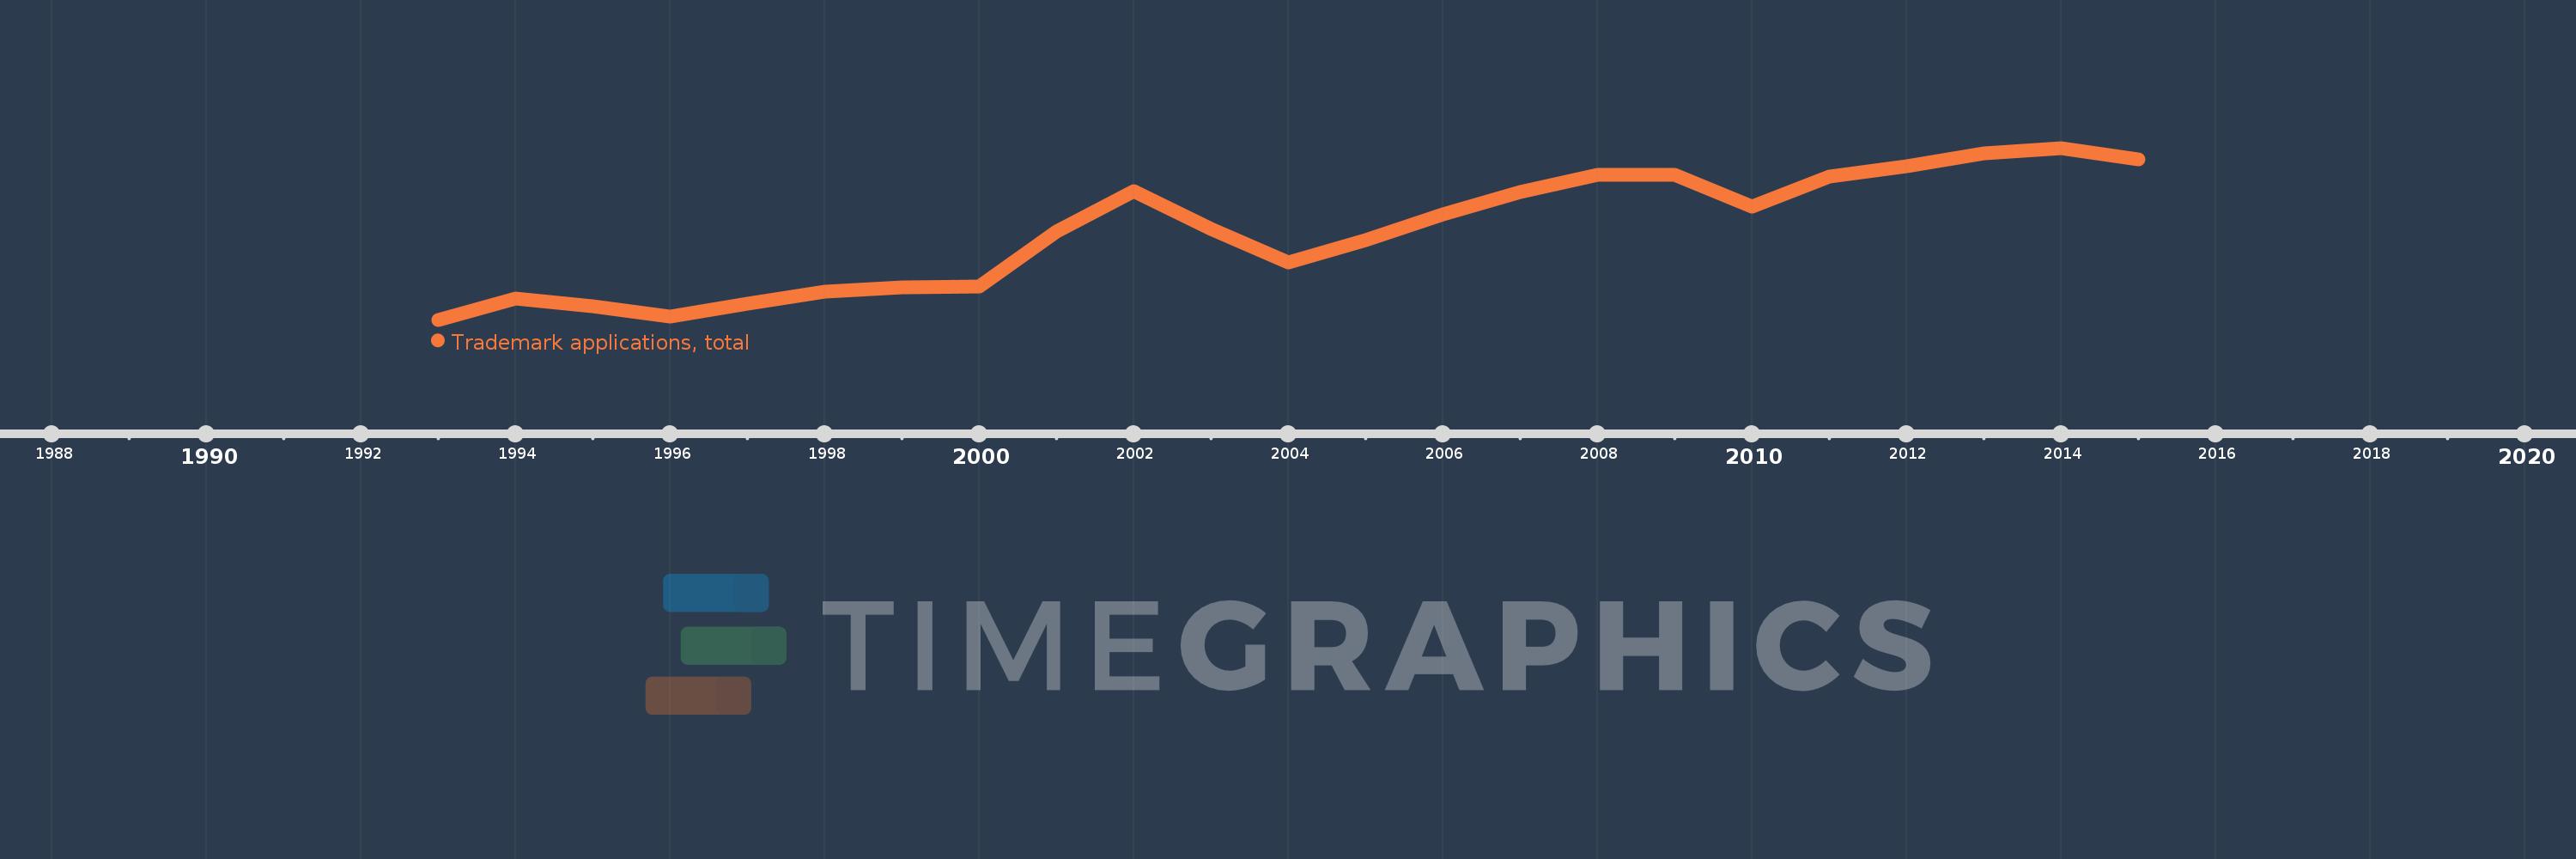
This timeline shows a graph from 1993 to 2015 of Russian Federation. No data until 1992. Number of actual observations by date: 23.
Source name:
World Development Indicators
Source organization:
World Intellectual Property Organization (WIPO), World Intellectual Property Indicators and www.wipo.int/econ_stat. The International Bureau of WIPO assumes no responsibility with respect to the transformation of these data.
Categories, topics:
Science & Technology
Last updated:
apr 23, 2017
Indicators value changes by year
Meaning:
42.804K
Minimum:
20.512K
jan 1, 1993
Maximum:
64.062K
jan 1, 2014
At the date of observation
Value
Absolute change
Change from the previous value
jan 1, 1993
20.512K
+20.512K
0.0%
jan 1, 1994
25.92K
+5.408K
26.37%
jan 1, 1995
23.875K
-2.045K
-7.89%
jan 1, 1996
21.403K
-2.472K
-10.35%
jan 1, 1997
24.603K
+3.2K
14.95%
jan 1, 1998
27.672K
+3.069K
12.47%
jan 1, 1999
28.619K
+947.0
3.42%
jan 1, 2000
28.973K
+354.0
1.24%
jan 1, 2001
42.814K
+13.841K
47.77%
jan 1, 2002
53.096K
+10.282K
24.02%
jan 1, 2003
43.494K
-9.602K
-18.08%
jan 1, 2004
35.091K
-8.403K
-19.32%
jan 1, 2005
40.611K
+5.52K
15.73%
jan 1, 2006
47.222K
+6.611K
16.28%
jan 1, 2007
52.867K
+5.645K
11.95%
jan 1, 2008
57.346K
+4.479K
8.47%
jan 1, 2009
57.165K
-181.0
-0.32%
jan 1, 2010
49.189K
-7.976K
-13.95%
jan 1, 2011
56.856K
+7.667K
15.59%
jan 1, 2012
59.341K
+2.485K
4.37%
jan 1, 2013
62.694K
+3.353K
5.65%
jan 1, 2014
64.062K
+1.368K
2.18%
jan 1, 2015
61.078K
-2.984K
-4.66%
Ranking of countries by current statistics by years