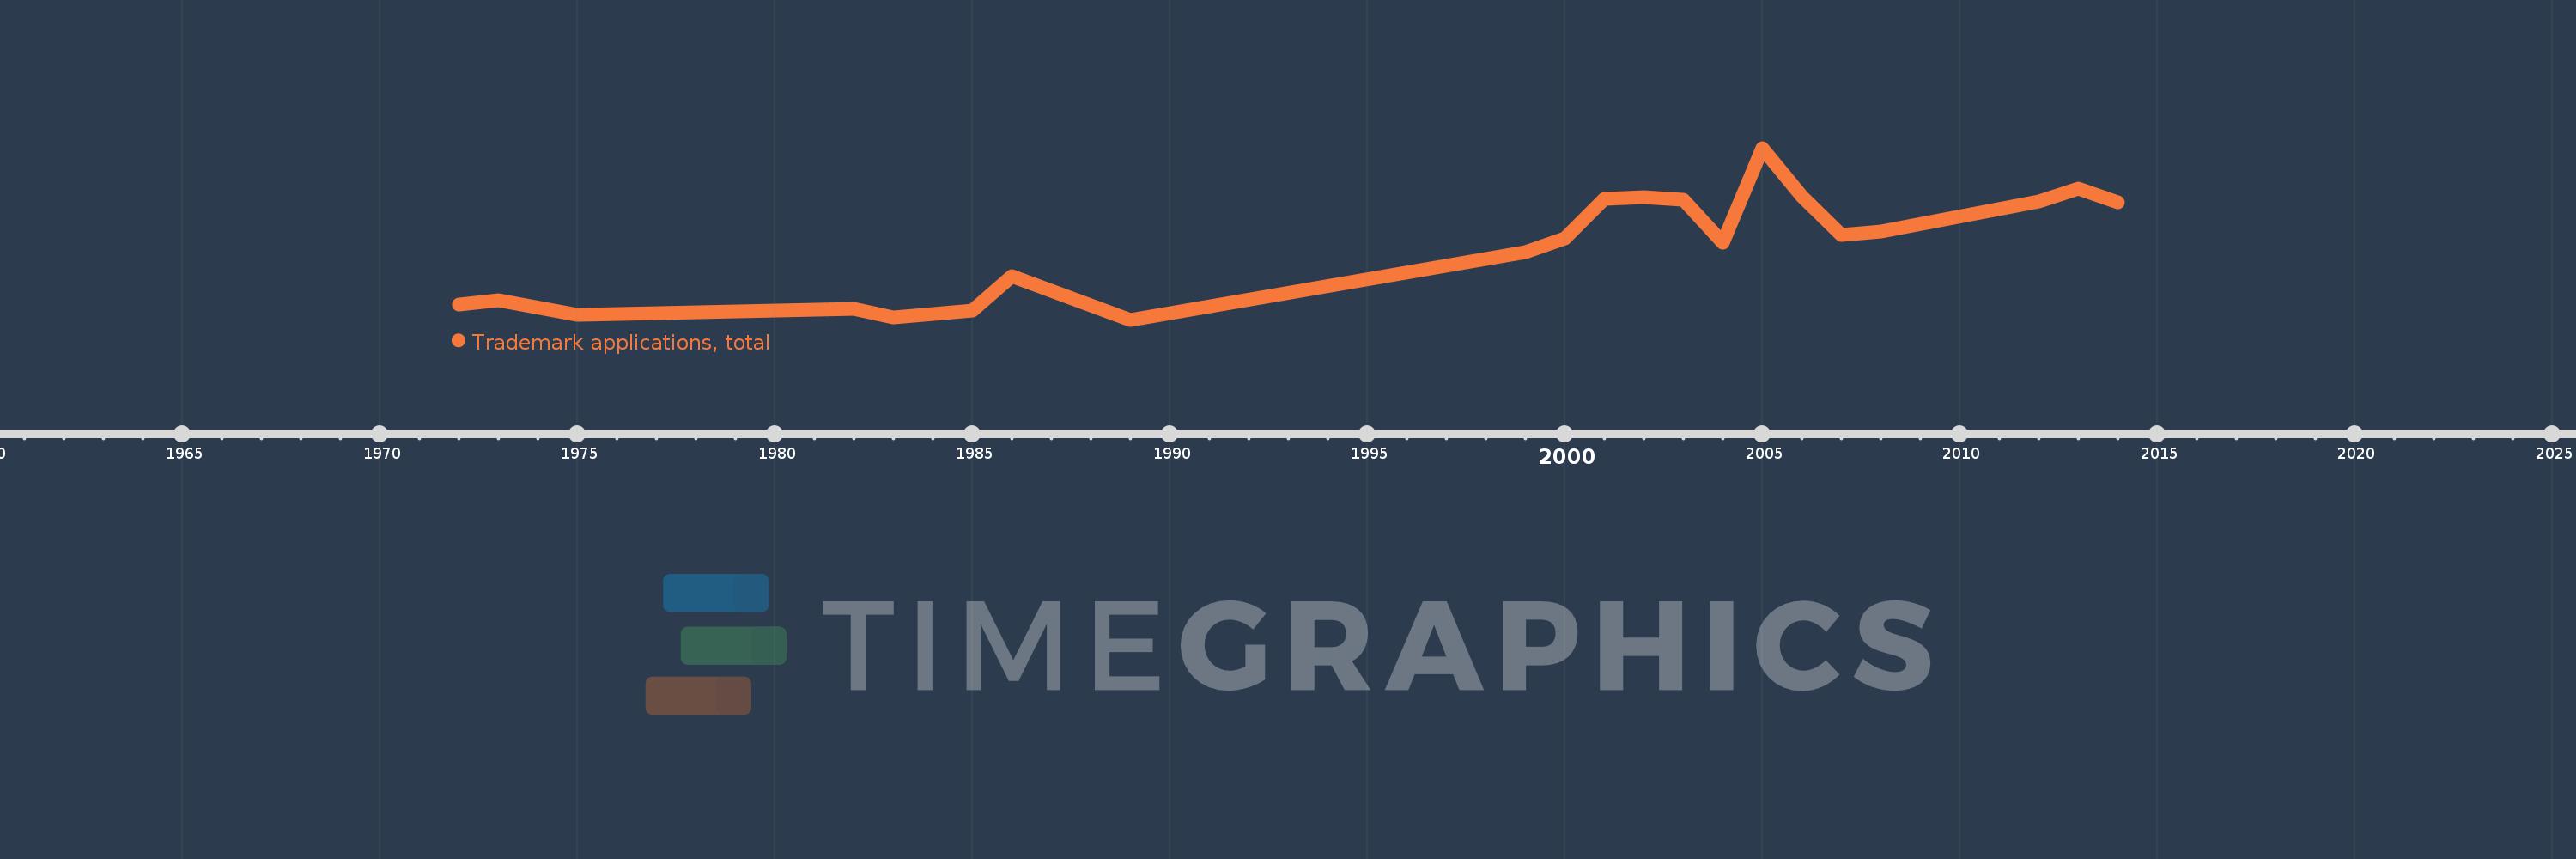
This timeline shows a graph from 1972 to 2014 of Gambia, The. No data until 1971. Number of actual observations by date: 21.
Source name:
World Development Indicators
Source organization:
World Intellectual Property Organization (WIPO), World Intellectual Property Indicators and www.wipo.int/econ_stat. The International Bureau of WIPO assumes no responsibility with respect to the transformation of these data.
Categories, topics:
Science & Technology
Last updated:
apr 23, 2017
Indicators value changes by year
Meaning:
286.286
Minimum:
92.0
jan 1, 1989
Maximum:
550.0
jan 1, 2005
At the date of observation
Value
Absolute change
Change from the previous value
jan 1, 1972
133.0
+133.0
0.0%
jan 1, 1973
145.0
+12.0
9.02%
jan 1, 1975
104.0
-41.0
-28.28%
jan 1, 1982
121.0
+17.0
16.35%
jan 1, 1983
98.0
-23.0
-19.01%
jan 1, 1985
116.0
+18.0
18.37%
jan 1, 1986
207.0
+91.0
78.45%
jan 1, 1989
92.0
-115.0
-55.56%
jan 1, 1999
272.0
+180.0
195.65%
jan 1, 2000
309.0
+37.0
13.6%
jan 1, 2001
415.0
+106.0
34.3%
jan 1, 2002
419.0
+4.0
0.96%
jan 1, 2003
412.0
-7.0
-1.67%
jan 1, 2004
298.0
-114.0
-27.67%
jan 1, 2005
550.0
+252.0
84.56%
jan 1, 2006
421.0
-129.0
-23.45%
jan 1, 2007
319.0
-102.0
-24.23%
jan 1, 2008
327.0
+8.0
2.51%
jan 1, 2012
407.0
+80.0
24.46%
jan 1, 2013
441.0
+34.0
8.35%
jan 1, 2014
406.0
-35.0
-7.94%
Ranking of countries by current statistics by years