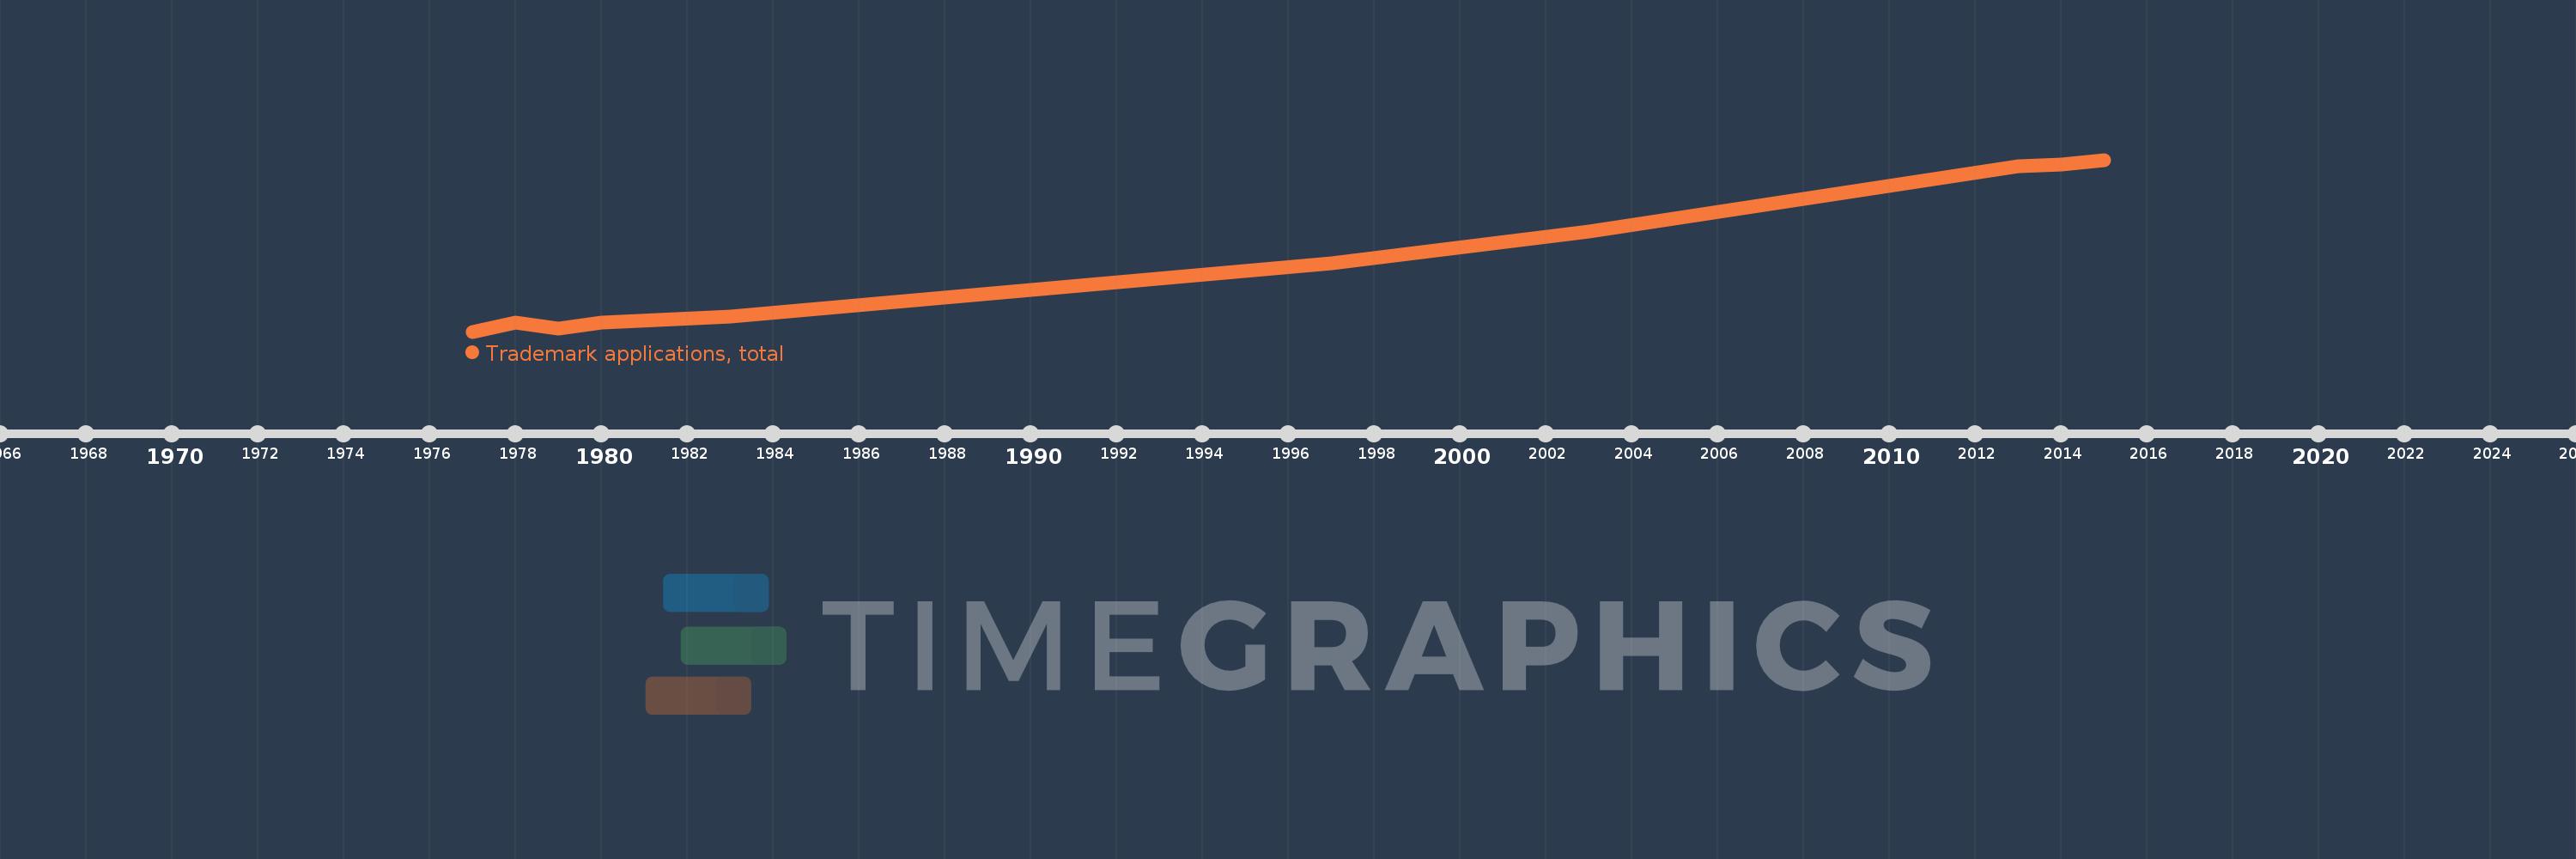
This timeline shows a graph from 1977 to 2015 of Caribbean small states. No data until 1976. Number of actual observations by date: 10.
Source name:
World Development Indicators
Source organization:
World Intellectual Property Organization (WIPO), World Intellectual Property Indicators and www.wipo.int/econ_stat. The International Bureau of WIPO assumes no responsibility with respect to the transformation of these data.
Categories, topics:
Science & Technology
Last updated:
apr 23, 2017
Indicators value changes by year
Meaning:
5.309K
Minimum:
1.735K
jan 1, 1977
Maximum:
10.399K
jan 1, 2015
At the date of observation
Value
Absolute change
Change from the previous value
jan 1, 1977
1.735K
+1.735K
0.0%
jan 1, 1978
2.185K
+450.0
25.94%
jan 1, 1979
1.885K
-300.0
-13.73%
jan 1, 1980
2.189K
+304.0
16.13%
jan 1, 1983
2.494K
+305.0
13.93%
jan 1, 1997
5.173K
+2.679K
107.42%
jan 1, 2003
6.779K
+1.606K
31.05%
jan 1, 2013
10.089K
+3.31K
48.83%
jan 1, 2014
10.163K
+74.0
0.73%
jan 1, 2015
10.399K
+236.0
2.32%
Ranking of countries by current statistics by years