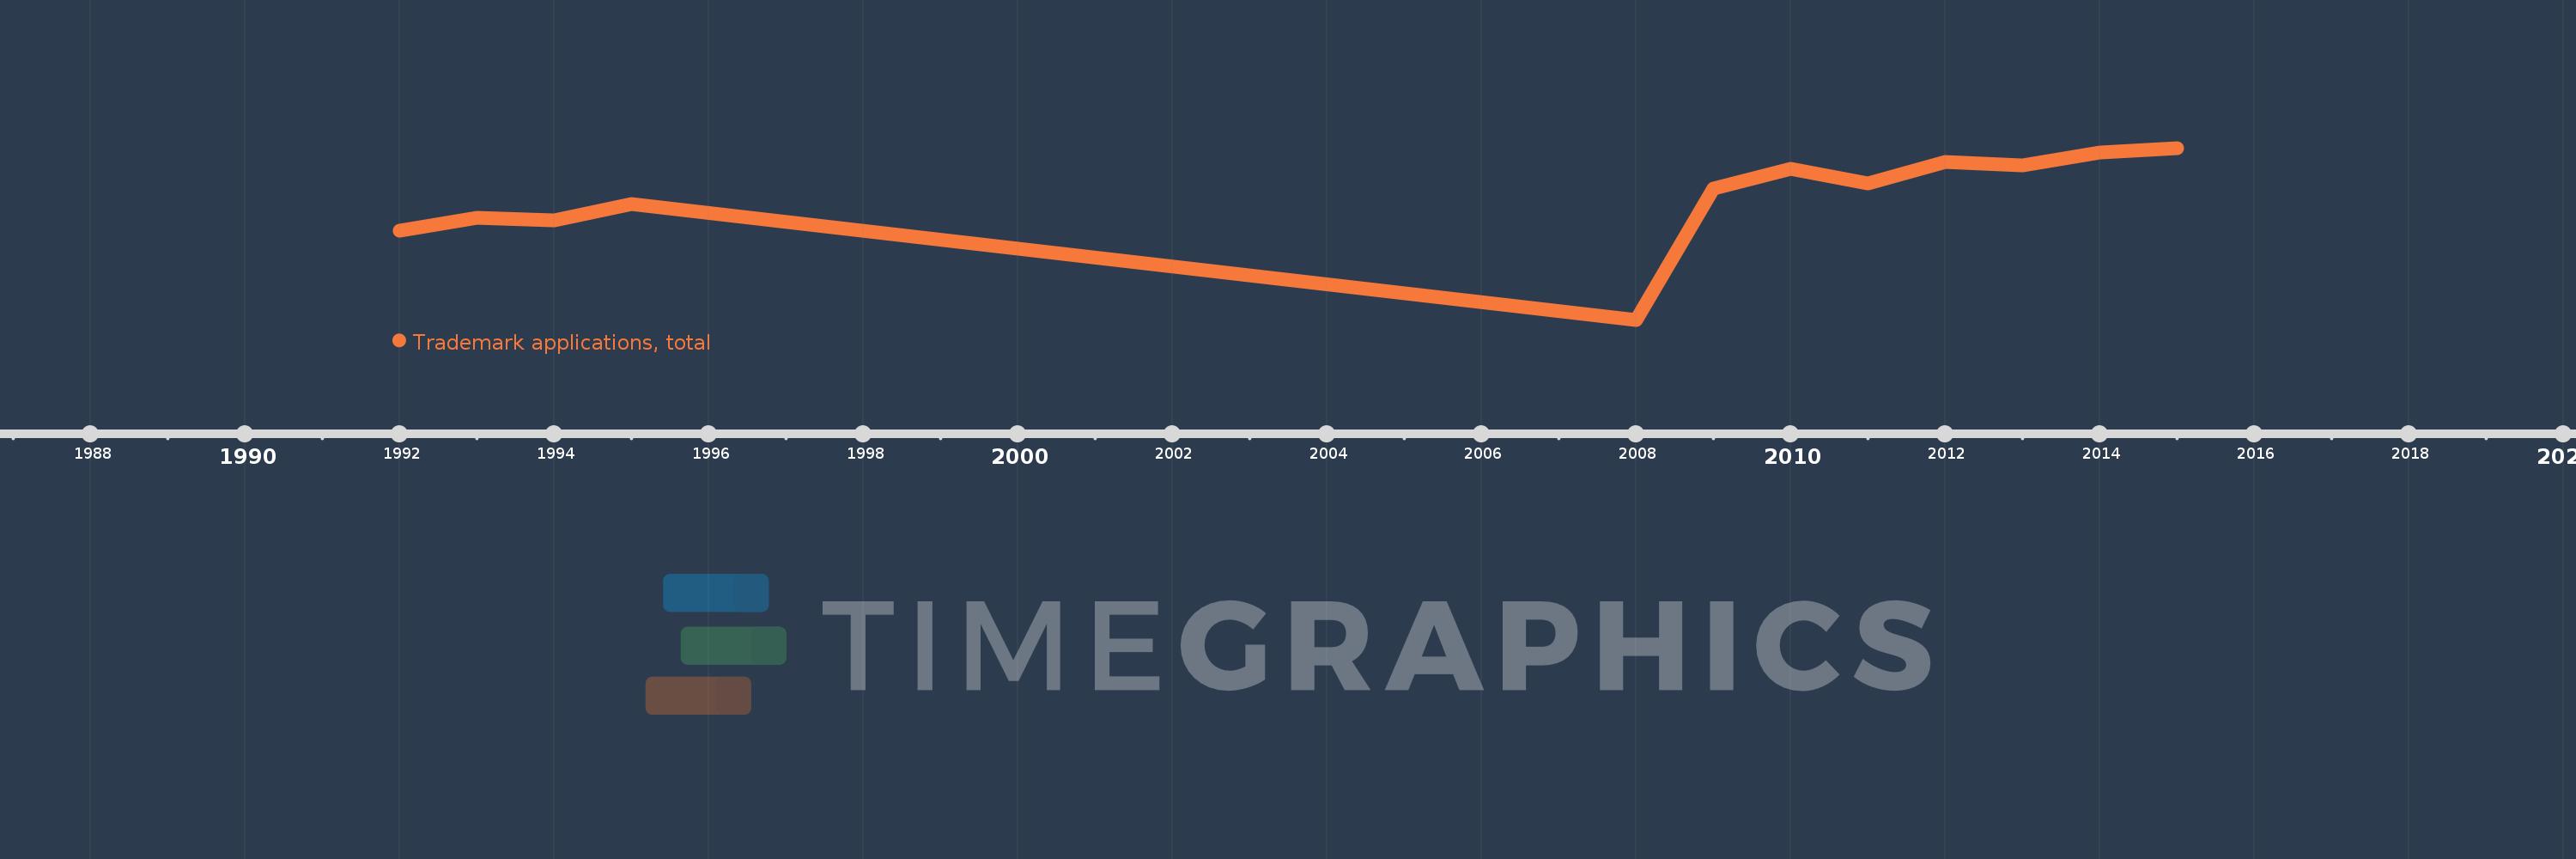
This timeline shows a graph from 1992 to 2015 of Oman. No data until 1991. Number of actual observations by date: 12.
Source name:
World Development Indicators
Source organization:
World Intellectual Property Organization (WIPO), World Intellectual Property Indicators and www.wipo.int/econ_stat. The International Bureau of WIPO assumes no responsibility with respect to the transformation of these data.
Categories, topics:
Science & Technology
Last updated:
apr 23, 2017
Indicators value changes by year
Meaning:
1.736K
Minimum:
118.0
jan 1, 2008
Maximum:
2.378K
jan 1, 2015
At the date of observation
Value
Absolute change
Change from the previous value
jan 1, 1992
1.295K
+1.295K
0.0%
jan 1, 1993
1.457K
+162.0
12.51%
jan 1, 1994
1.429K
-28.0
-1.92%
jan 1, 1995
1.638K
+209.0
14.63%
jan 1, 2008
118.0
-1.52K
-92.8%
jan 1, 2009
1.847K
+1.729K
1.47K%
jan 1, 2010
2.103K
+256.0
13.86%
jan 1, 2011
1.911K
-192.0
-9.13%
jan 1, 2012
2.189K
+278.0
14.55%
jan 1, 2013
2.148K
-41.0
-1.87%
jan 1, 2014
2.319K
+171.0
7.96%
jan 1, 2015
2.378K
+59.0
2.54%
Ranking of countries by current statistics by years