33
/
AIzaSyB4mHJ5NPEv-XzF7P6NDYXjlkCWaeKw5bc
November 30, 2025
149838
Haiti
HTI
true
2
1
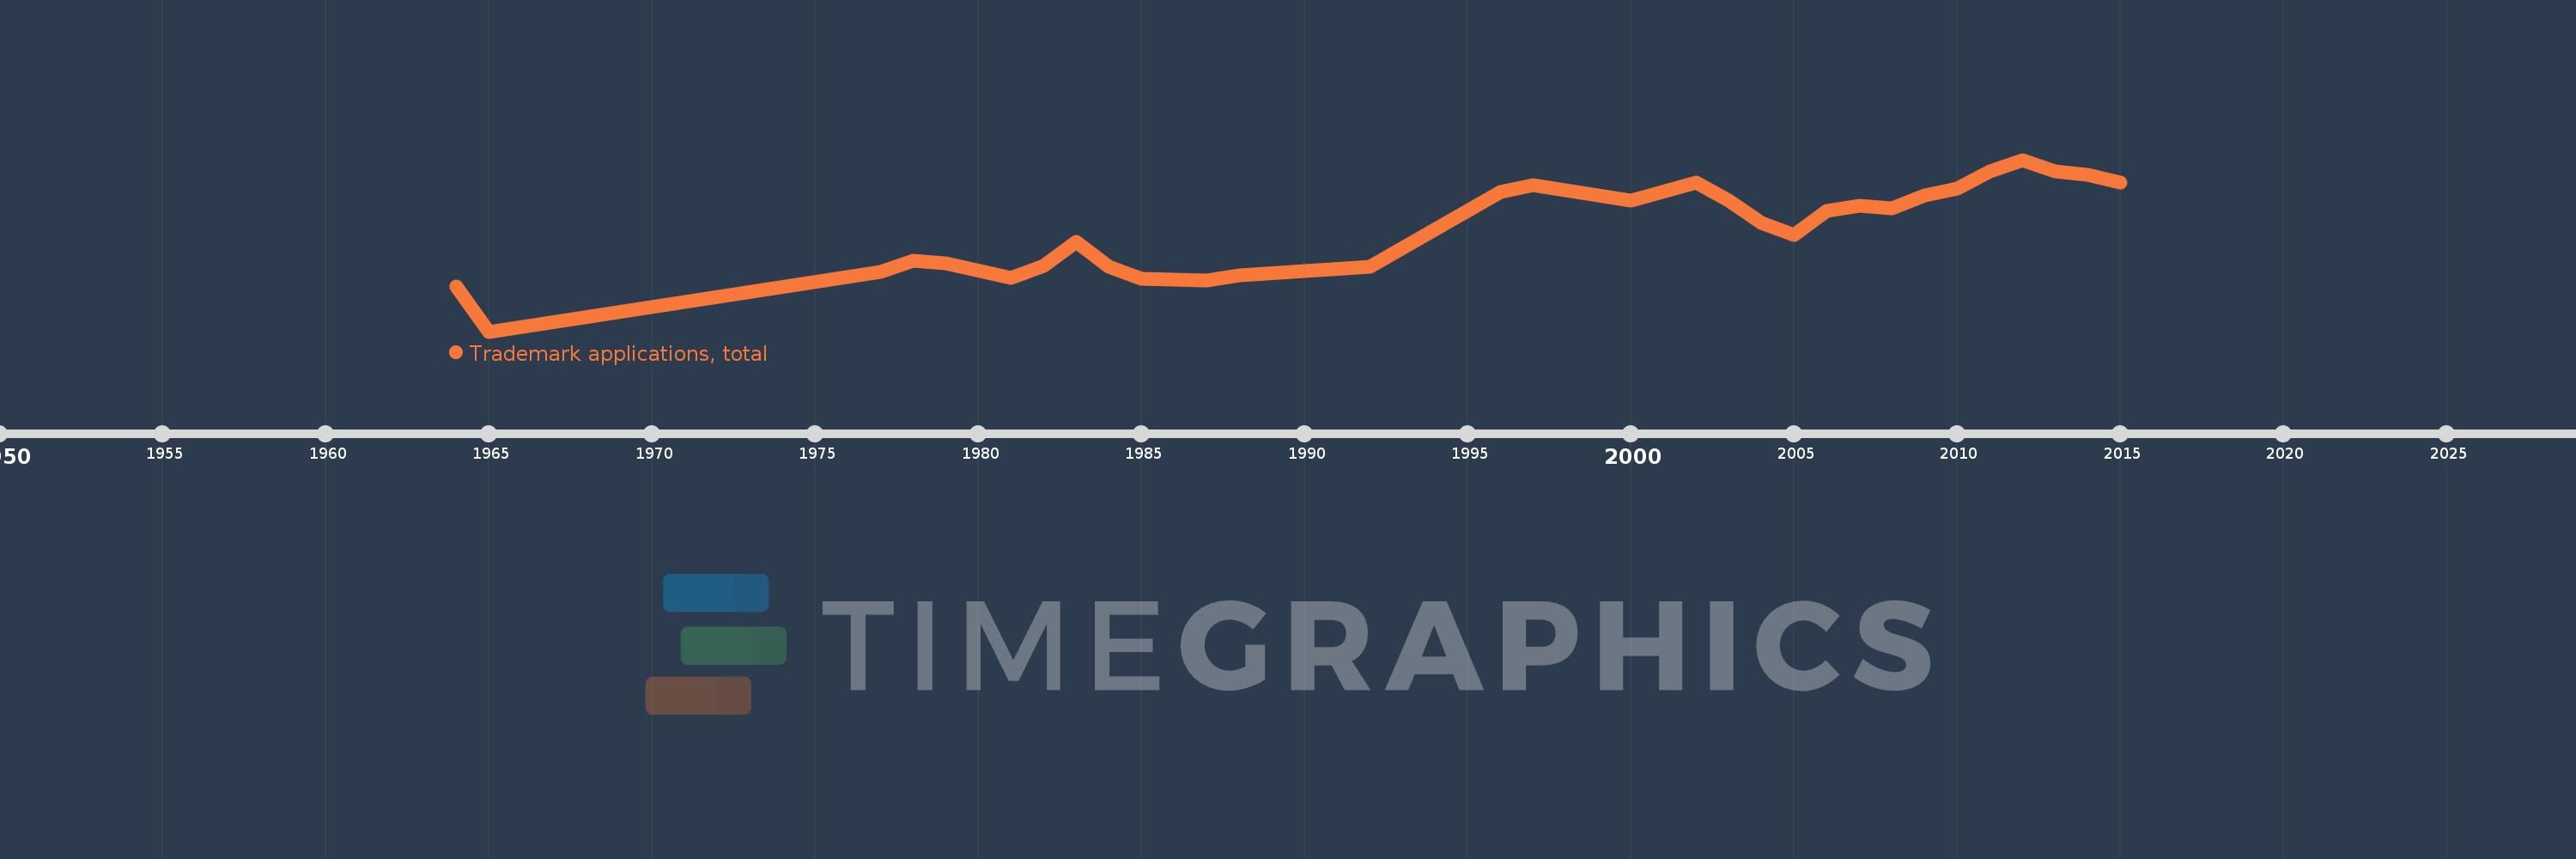
Trademark applications, total
2015,2014,2013,2012,2011,2010,2009,2008,2007,2006,2005,2004,2003,2002,2000,1997,1996,1992,1988,1987,1985,1984,1983,1982,1981,1979,1978,1977,1965,1964