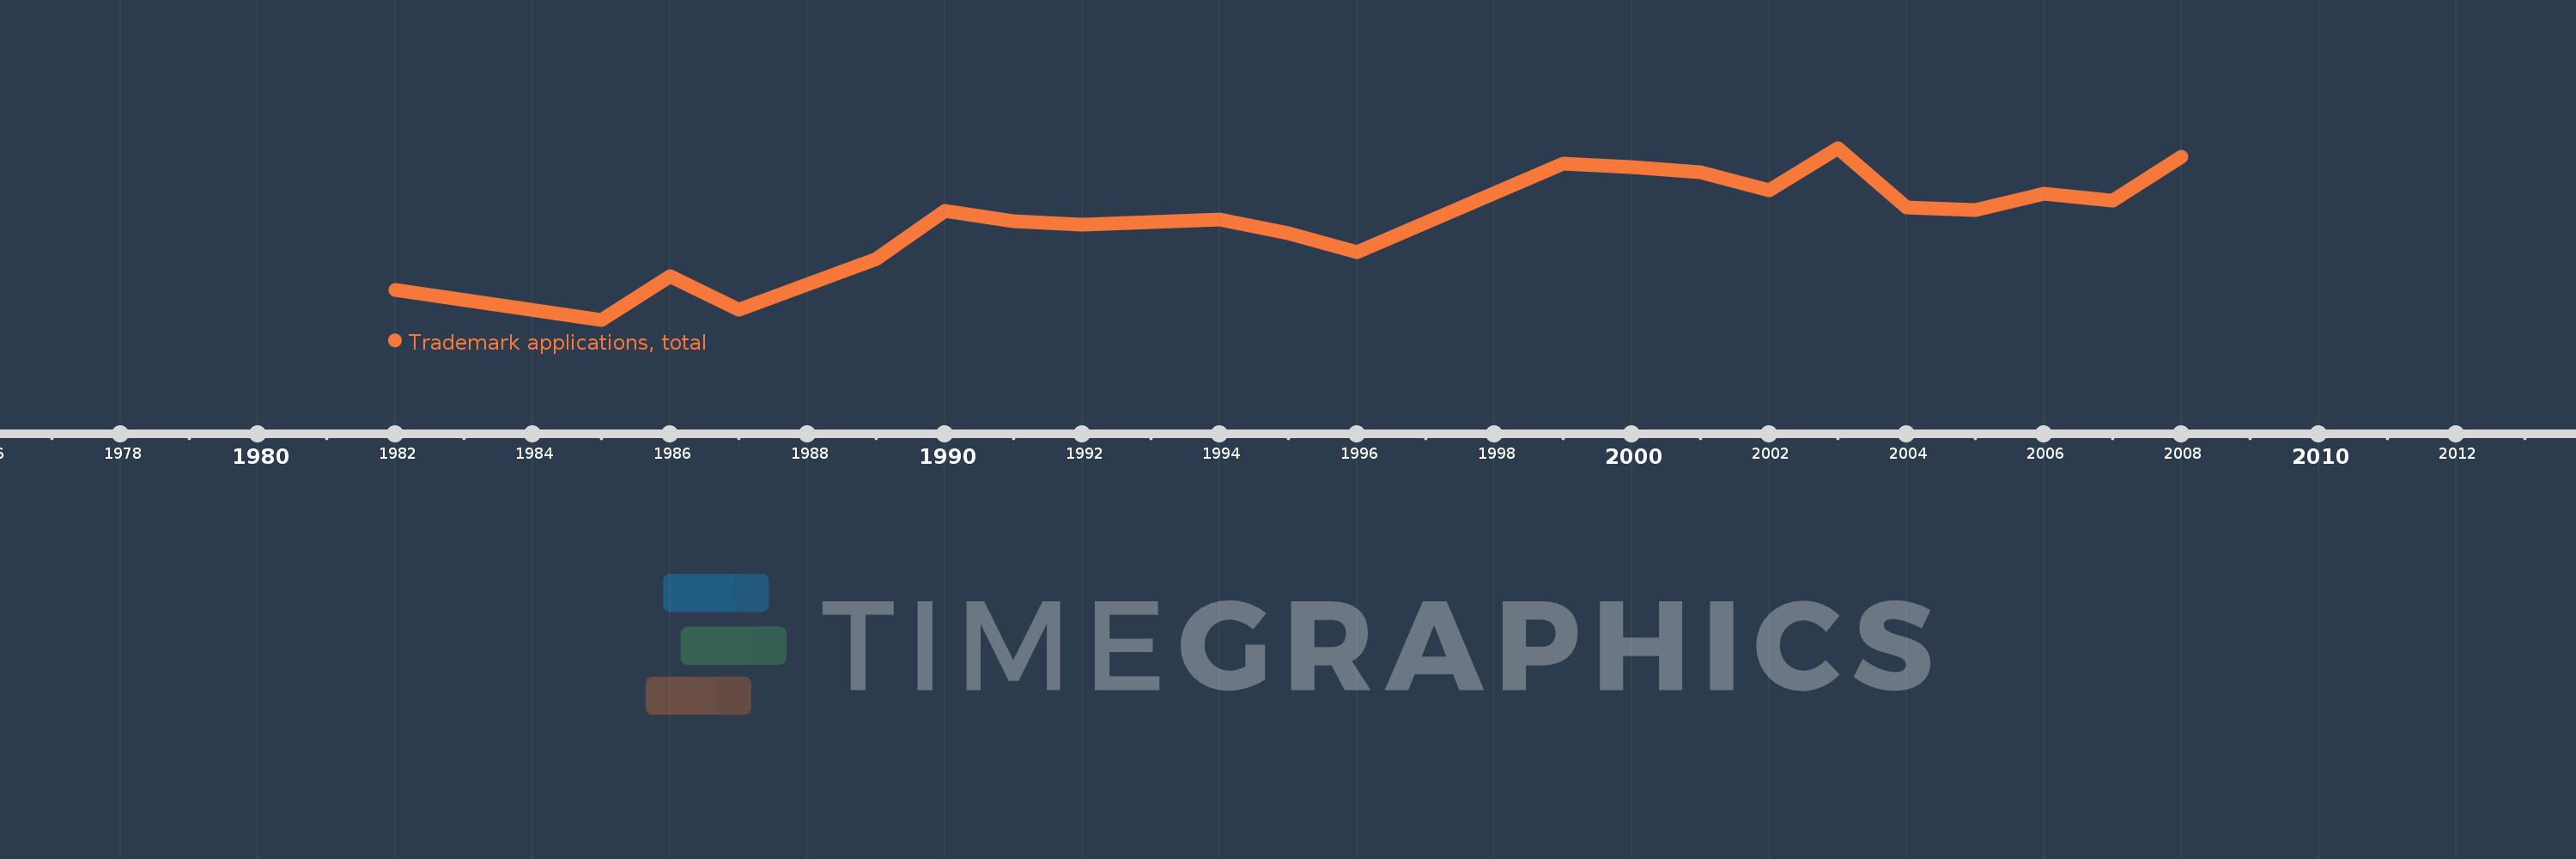
This timeline shows a graph from 1982 to 2008 of Ethiopia. No data until 1981. Number of actual observations by date: 21.
Source name:
World Development Indicators
Source organization:
World Intellectual Property Organization (WIPO), World Intellectual Property Indicators and www.wipo.int/econ_stat. The International Bureau of WIPO assumes no responsibility with respect to the transformation of these data.
Categories, topics:
Science & Technology
Last updated:
apr 23, 2017
Indicators value changes by year
Meaning:
469.048
Minimum:
77.0
jan 1, 1985
Maximum:
753.0
jan 1, 2003
At the date of observation
Value
Absolute change
Change from the previous value
jan 1, 1982
195.0
+195.0
0.0%
jan 1, 1985
77.0
-118.0
-60.51%
jan 1, 1986
249.0
+172.0
223.38%
jan 1, 1987
117.0
-132.0
-53.01%
jan 1, 1989
316.0
+199.0
170.09%
jan 1, 1990
506.0
+190.0
60.13%
jan 1, 1991
466.0
-40.0
-7.91%
jan 1, 1992
452.0
-14.0
-3.0%
jan 1, 1994
473.0
+21.0
4.65%
jan 1, 1995
417.0
-56.0
-11.84%
jan 1, 1996
342.0
-75.0
-17.99%
jan 1, 1999
692.0
+350.0
102.34%
jan 1, 2000
679.0
-13.0
-1.88%
jan 1, 2001
659.0
-20.0
-2.95%
jan 1, 2002
588.0
-71.0
-10.77%
jan 1, 2003
753.0
+165.0
28.06%
jan 1, 2004
520.0
-233.0
-30.94%
jan 1, 2005
510.0
-10.0
-1.92%
jan 1, 2006
574.0
+64.0
12.55%
jan 1, 2007
546.0
-28.0
-4.88%
jan 1, 2008
719.0
+173.0
31.68%
Ranking of countries by current statistics by years