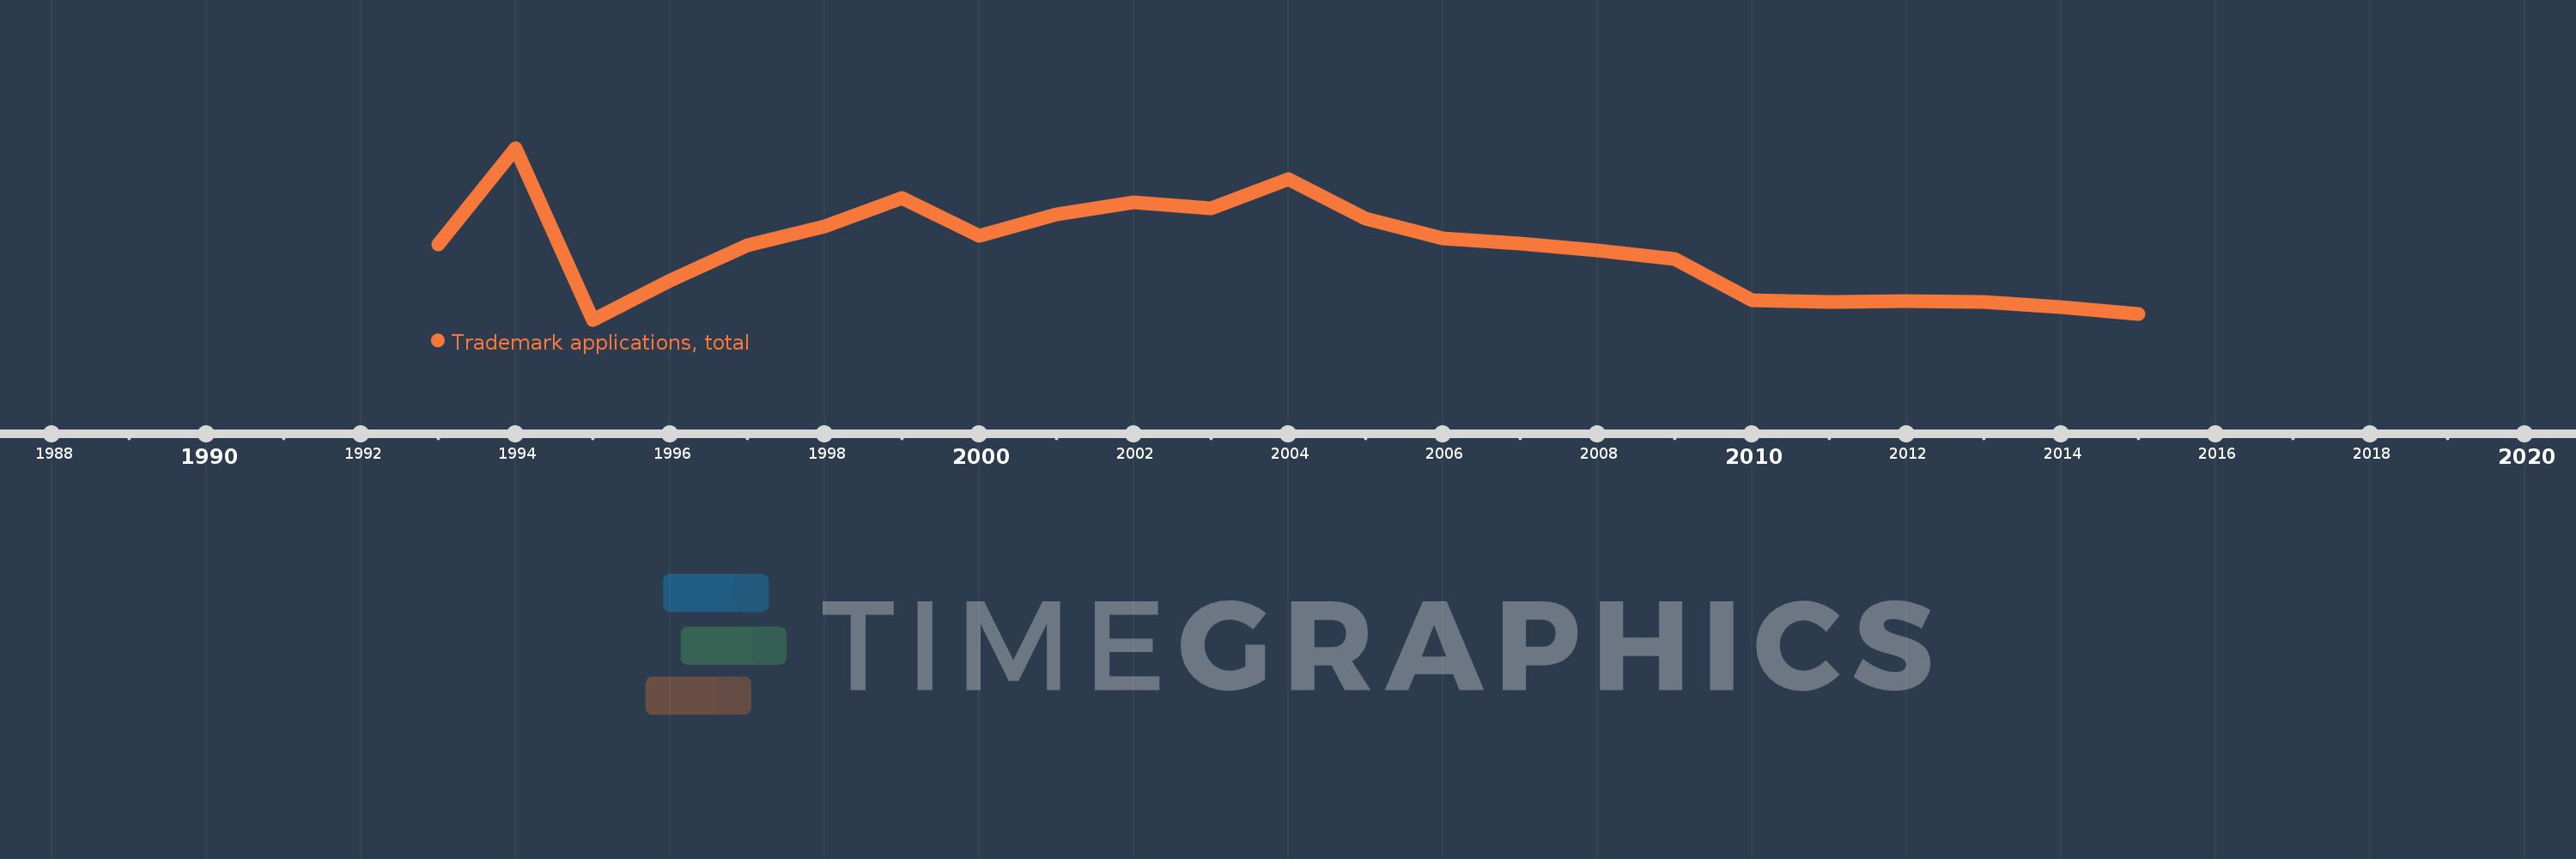
This timeline shows a graph from 1993 to 2015 of Latvia. No data until 1992. Number of actual observations by date: 23.
Source name:
World Development Indicators
Source organization:
World Intellectual Property Organization (WIPO), World Intellectual Property Indicators and www.wipo.int/econ_stat. The International Bureau of WIPO assumes no responsibility with respect to the transformation of these data.
Categories, topics:
Science & Technology
Last updated:
apr 23, 2017
Indicators value changes by year
Meaning:
5.445K
Minimum:
2.854K
jan 1, 1995
Maximum:
9.194K
jan 1, 1994
At the date of observation
Value
Absolute change
Change from the previous value
jan 1, 1993
5.621K
+5.621K
0.0%
jan 1, 1994
9.194K
+3.573K
63.57%
jan 1, 1995
2.854K
-6.34K
-68.96%
jan 1, 1996
4.315K
+1.461K
51.19%
jan 1, 1997
5.588K
+1.273K
29.5%
jan 1, 1998
6.31K
+722.0
12.92%
jan 1, 1999
7.334K
+1.024K
16.23%
jan 1, 2000
5.964K
-1.37K
-18.68%
jan 1, 2001
6.739K
+775.0
12.99%
jan 1, 2002
7.195K
+456.0
6.77%
jan 1, 2003
6.961K
-234.0
-3.25%
jan 1, 2004
8.03K
+1.069K
15.36%
jan 1, 2005
6.598K
-1.432K
-17.83%
jan 1, 2006
5.845K
-753.0
-11.41%
jan 1, 2007
5.665K
-180.0
-3.08%
jan 1, 2008
5.416K
-249.0
-4.4%
jan 1, 2009
5.101K
-315.0
-5.82%
jan 1, 2010
3.566K
-1.535K
-30.09%
jan 1, 2011
3.513K
-53.0
-1.49%
jan 1, 2012
3.545K
+32.0
0.91%
jan 1, 2013
3.501K
-44.0
-1.24%
jan 1, 2014
3.308K
-193.0
-5.51%
jan 1, 2015
3.062K
-246.0
-7.44%
Ranking of countries by current statistics by years