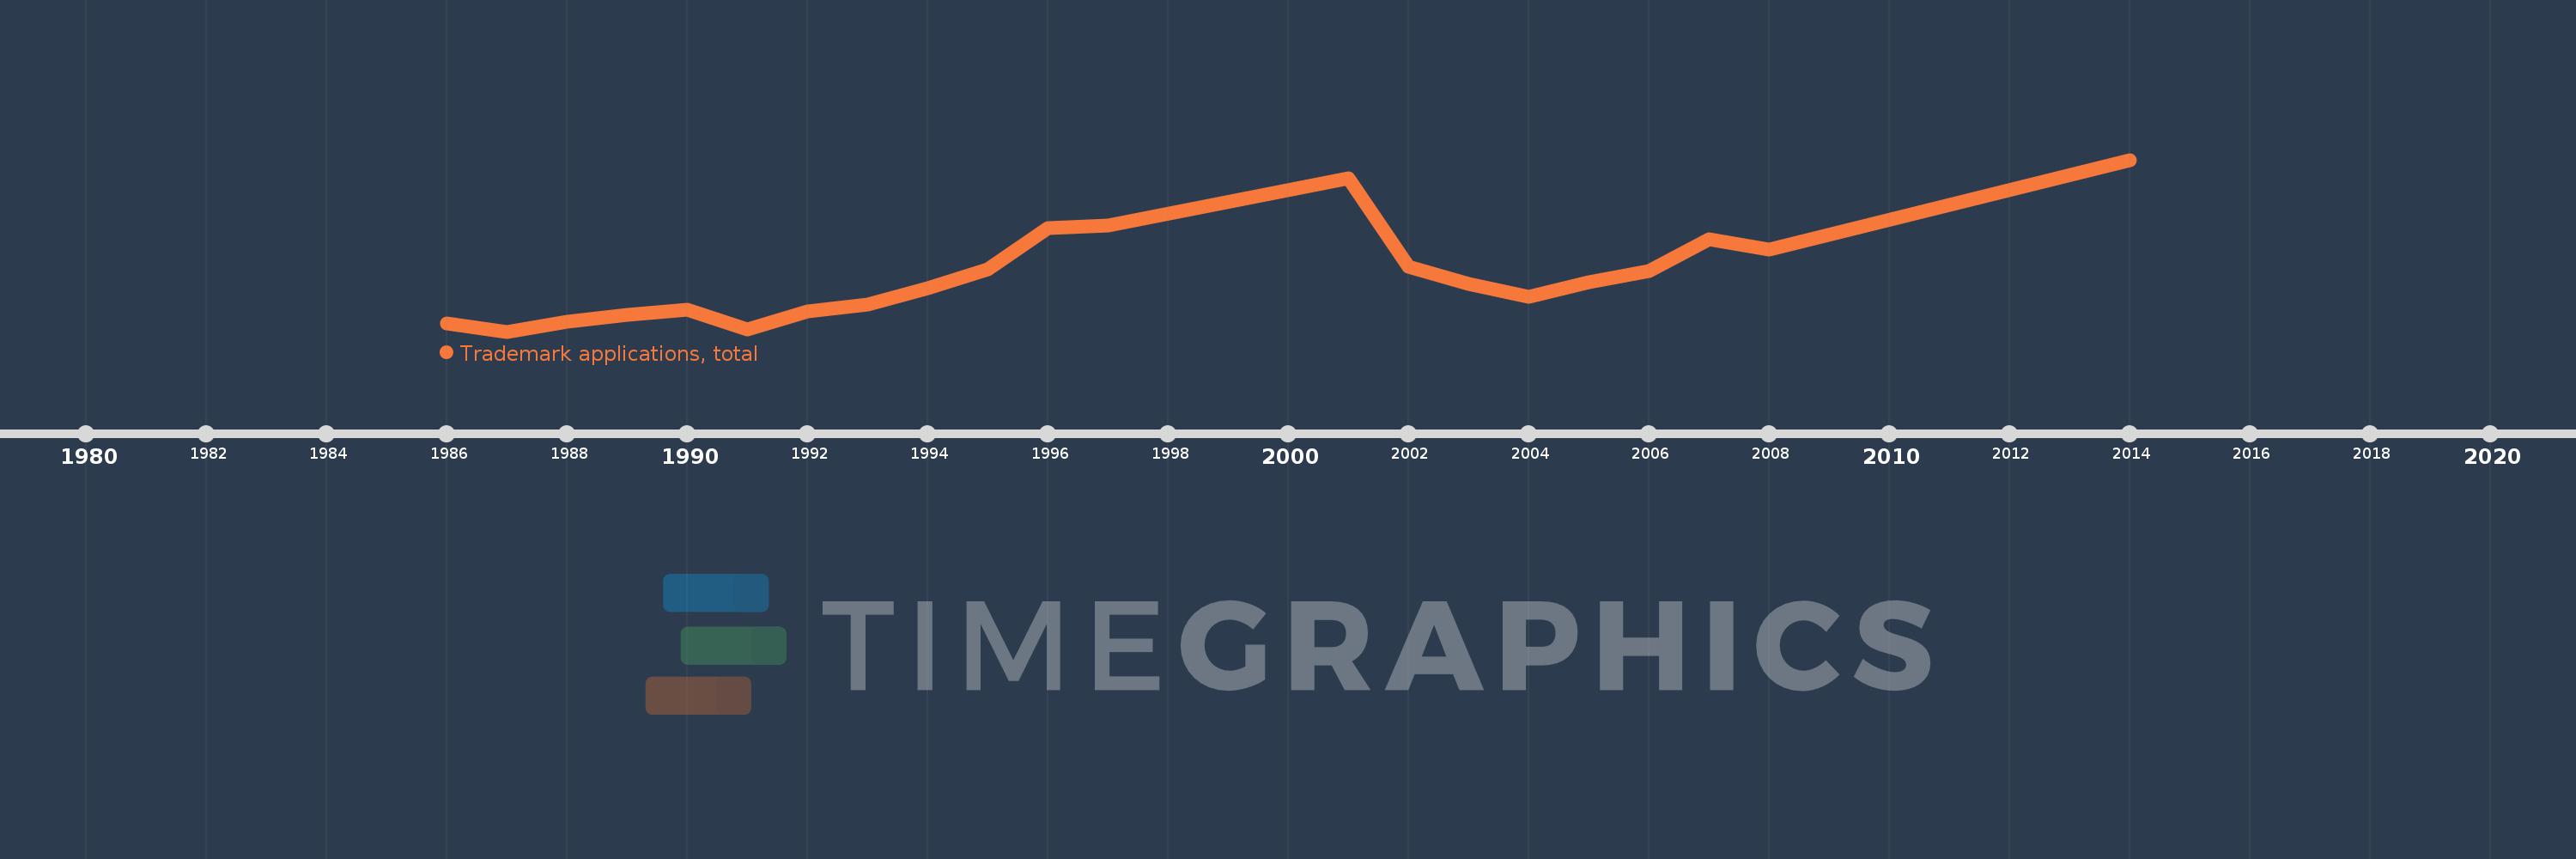
This timeline shows a graph from 1986 to 2014 of Papua New Guinea. No data until 1985. Number of actual observations by date: 21.
Source name:
World Development Indicators
Source organization:
World Intellectual Property Organization (WIPO), World Intellectual Property Indicators and www.wipo.int/econ_stat. The International Bureau of WIPO assumes no responsibility with respect to the transformation of these data.
Categories, topics:
Science & Technology
Last updated:
apr 23, 2017
Indicators value changes by year
Meaning:
496.476
Minimum:
243.0
jan 1, 1987
Maximum:
1.019K
jan 1, 2014
At the date of observation
Value
Absolute change
Change from the previous value
jan 1, 1986
280.0
+280.0
0.0%
jan 1, 1987
243.0
-37.0
-13.21%
jan 1, 1988
286.0
+43.0
17.7%
jan 1, 1989
320.0
+34.0
11.89%
jan 1, 1990
342.0
+22.0
6.88%
jan 1, 1991
253.0
-89.0
-26.02%
jan 1, 1992
335.0
+82.0
32.41%
jan 1, 1993
367.0
+32.0
9.55%
jan 1, 1994
438.0
+71.0
19.35%
jan 1, 1995
524.0
+86.0
19.63%
jan 1, 1996
710.0
+186.0
35.5%
jan 1, 1997
723.0
+13.0
1.83%
jan 1, 2001
935.0
+212.0
29.32%
jan 1, 2002
536.0
-399.0
-42.67%
jan 1, 2003
460.0
-76.0
-14.18%
jan 1, 2004
399.0
-61.0
-13.26%
jan 1, 2005
467.0
+68.0
17.04%
jan 1, 2006
517.0
+50.0
10.71%
jan 1, 2007
660.0
+143.0
27.66%
jan 1, 2008
612.0
-48.0
-7.27%
jan 1, 2014
1.019K
+407.0
66.5%
Ranking of countries by current statistics by years