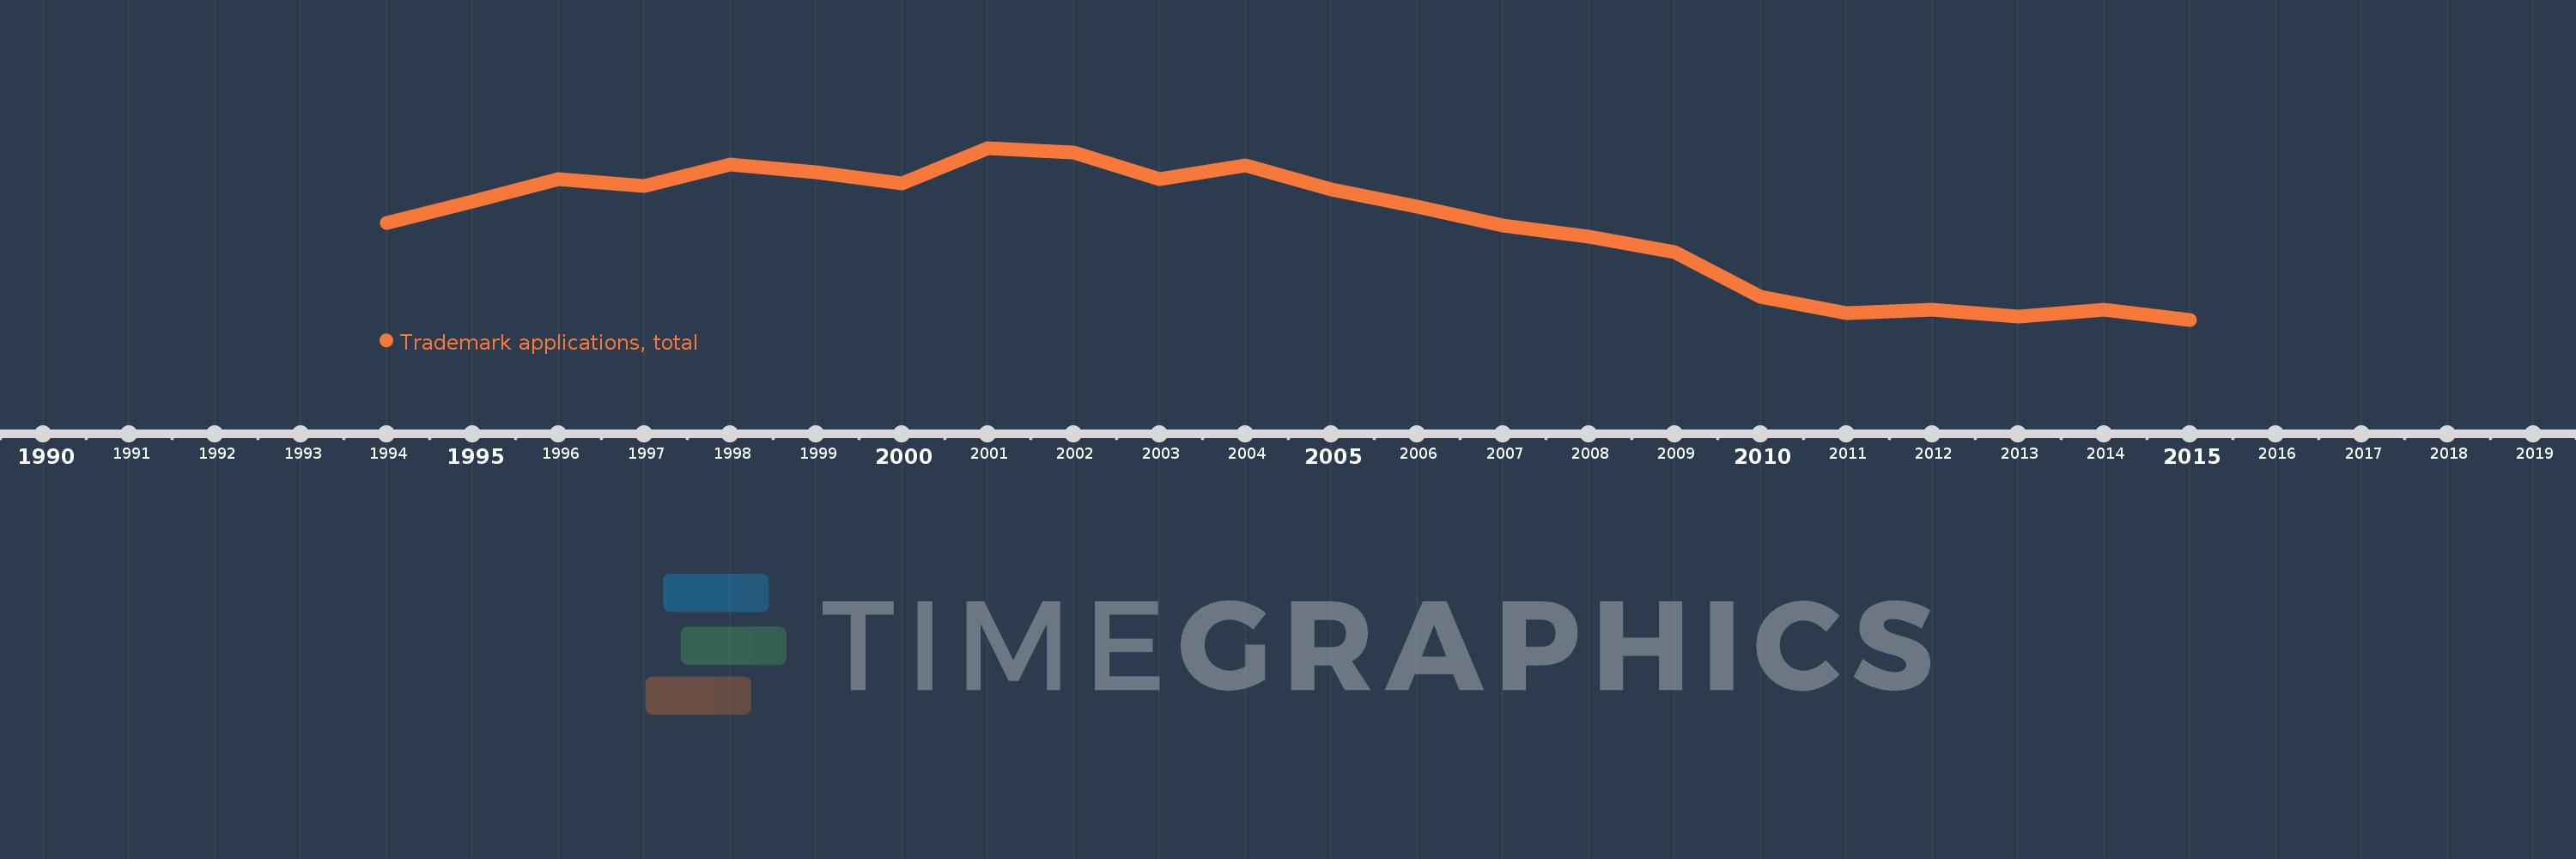
This timeline shows a graph from 1994 to 2015 of Slovak Republic. No data until 1993. Number of actual observations by date: 22.
Source name:
World Development Indicators
Source organization:
World Intellectual Property Organization (WIPO), World Intellectual Property Indicators and www.wipo.int/econ_stat. The International Bureau of WIPO assumes no responsibility with respect to the transformation of these data.
Categories, topics:
Science & Technology
Last updated:
apr 23, 2017
Indicators value changes by year
Meaning:
8.343K
Minimum:
4.629K
jan 1, 2015
Maximum:
11.299K
jan 1, 2001
At the date of observation
Value
Absolute change
Change from the previous value
jan 1, 1994
8.388K
+8.388K
0.0%
jan 1, 1995
9.235K
+847.0
10.1%
jan 1, 1996
10.073K
+838.0
9.07%
jan 1, 1997
9.824K
-249.0
-2.47%
jan 1, 1998
10.652K
+828.0
8.43%
jan 1, 1999
10.352K
-300.0
-2.82%
jan 1, 2000
9.921K
-431.0
-4.16%
jan 1, 2001
11.299K
+1.378K
13.89%
jan 1, 2002
11.116K
-183.0
-1.62%
jan 1, 2003
10.092K
-1.024K
-9.21%
jan 1, 2004
10.634K
+542.0
5.37%
jan 1, 2005
9.695K
-939.0
-8.83%
jan 1, 2006
9.012K
-683.0
-7.04%
jan 1, 2007
8.282K
-730.0
-8.1%
jan 1, 2008
7.853K
-429.0
-5.18%
jan 1, 2009
7.267K
-586.0
-7.46%
jan 1, 2010
5.534K
-1.733K
-23.85%
jan 1, 2011
4.887K
-647.0
-11.69%
jan 1, 2012
5.02K
+133.0
2.72%
jan 1, 2013
4.744K
-276.0
-5.5%
jan 1, 2014
5.032K
+288.0
6.07%
jan 1, 2015
4.629K
-403.0
-8.01%
Ranking of countries by current statistics by years