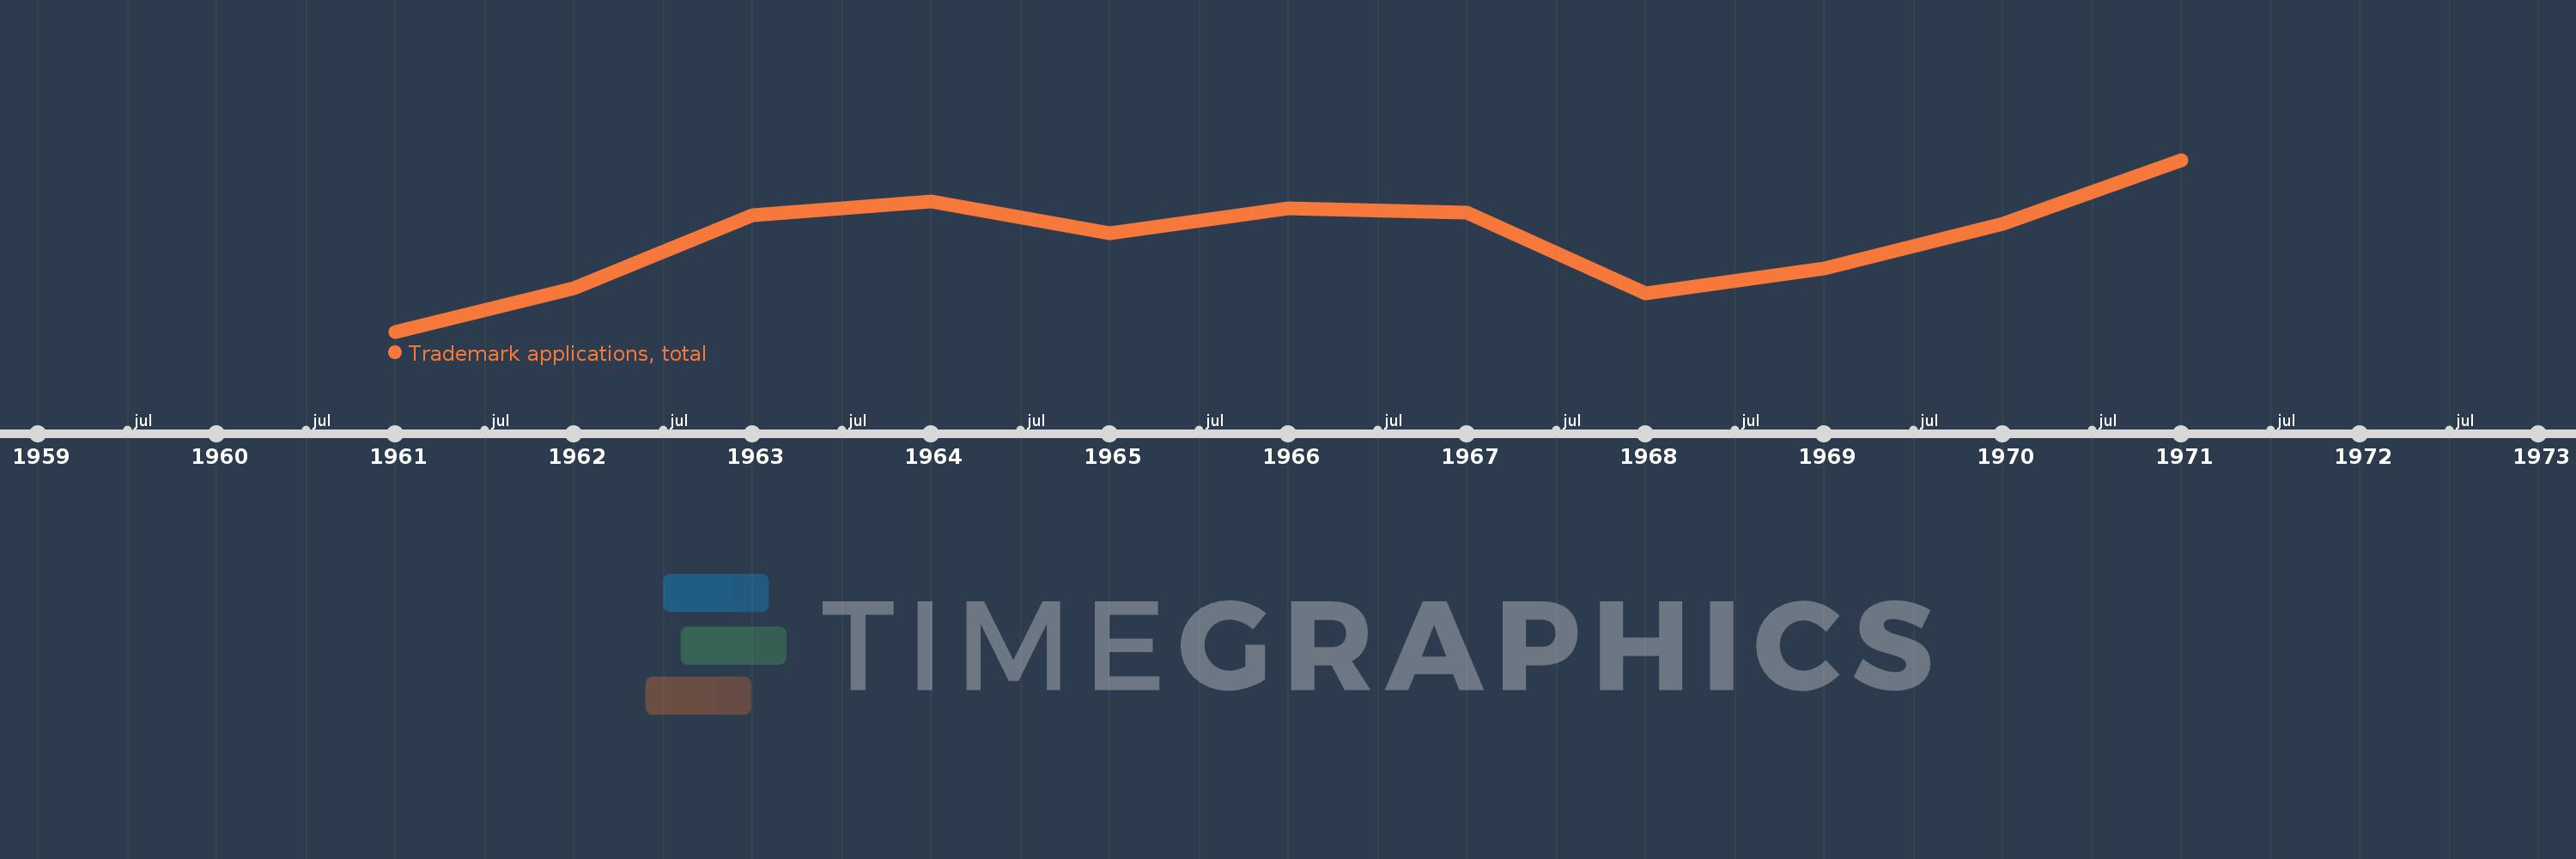
This timeline shows a graph from 1961 to 1971 of Netherlands. No data until 1960. Number of actual observations by date: 11.
Source name:
World Development Indicators
Source organization:
World Intellectual Property Organization (WIPO), World Intellectual Property Indicators and www.wipo.int/econ_stat. The International Bureau of WIPO assumes no responsibility with respect to the transformation of these data.
Categories, topics:
Science & Technology
Last updated:
apr 23, 2017
Indicators value changes by year
Meaning:
5.589K
Minimum:
5.054K
jan 1, 1961
Maximum:
6.055K
jan 1, 1971
At the date of observation
Value
Absolute change
Change from the previous value
jan 1, 1961
5.054K
+5.054K
0.0%
jan 1, 1962
5.305K
+251.0
4.97%
jan 1, 1963
5.73K
+425.0
8.01%
jan 1, 1964
5.811K
+81.0
1.41%
jan 1, 1965
5.627K
-184.0
-3.17%
jan 1, 1966
5.77K
+143.0
2.54%
jan 1, 1967
5.745K
-25.0
-0.43%
jan 1, 1968
5.275K
-470.0
-8.18%
jan 1, 1969
5.421K
+146.0
2.77%
jan 1, 1970
5.682K
+261.0
4.81%
jan 1, 1971
6.055K
+373.0
6.56%
Ranking of countries by current statistics by years