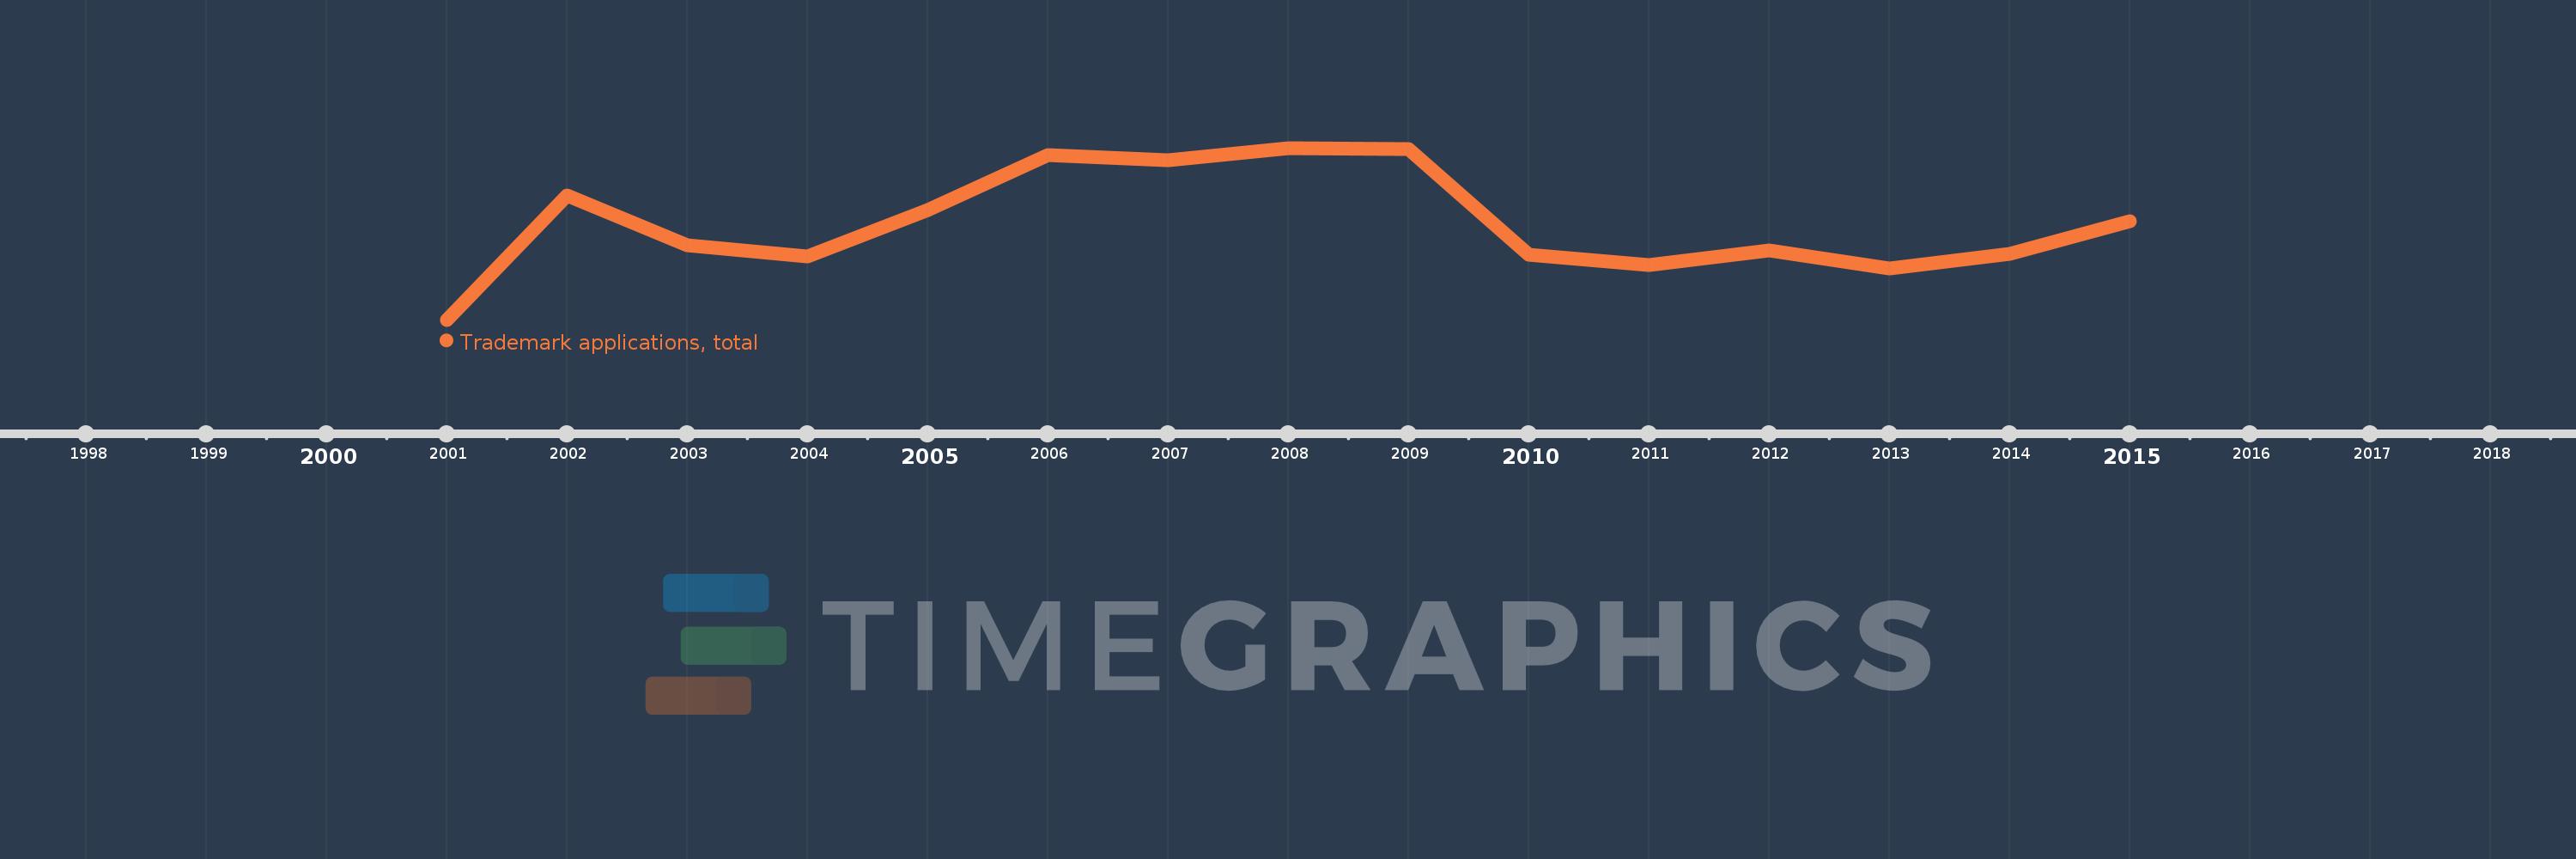
This timeline shows a graph from 2001 to 2015 of Antigua and Barbuda. No data until 2000. Number of actual observations by date: 15.
Source name:
World Development Indicators
Source organization:
World Intellectual Property Organization (WIPO), World Intellectual Property Indicators and www.wipo.int/econ_stat. The International Bureau of WIPO assumes no responsibility with respect to the transformation of these data.
Categories, topics:
Science & Technology
Last updated:
apr 23, 2017
Indicators value changes by year
Meaning:
808.133
Minimum:
525.0
jan 1, 2001
Maximum:
1.031K
jan 1, 2008
At the date of observation
Value
Absolute change
Change from the previous value
jan 1, 2001
525.0
+525.0
0.0%
jan 1, 2002
892.0
+367.0
69.9%
jan 1, 2003
745.0
-147.0
-16.48%
jan 1, 2004
712.0
-33.0
-4.43%
jan 1, 2005
847.0
+135.0
18.96%
jan 1, 2006
1.009K
+162.0
19.13%
jan 1, 2007
994.0
-15.0
-1.49%
jan 1, 2008
1.031K
+37.0
3.72%
jan 1, 2009
1.028K
-3.0
-0.29%
jan 1, 2010
716.0
-312.0
-30.35%
jan 1, 2011
685.0
-31.0
-4.33%
jan 1, 2012
729.0
+44.0
6.42%
jan 1, 2013
675.0
-54.0
-7.41%
jan 1, 2014
720.0
+45.0
6.67%
jan 1, 2015
814.0
+94.0
13.06%
Ranking of countries by current statistics by years