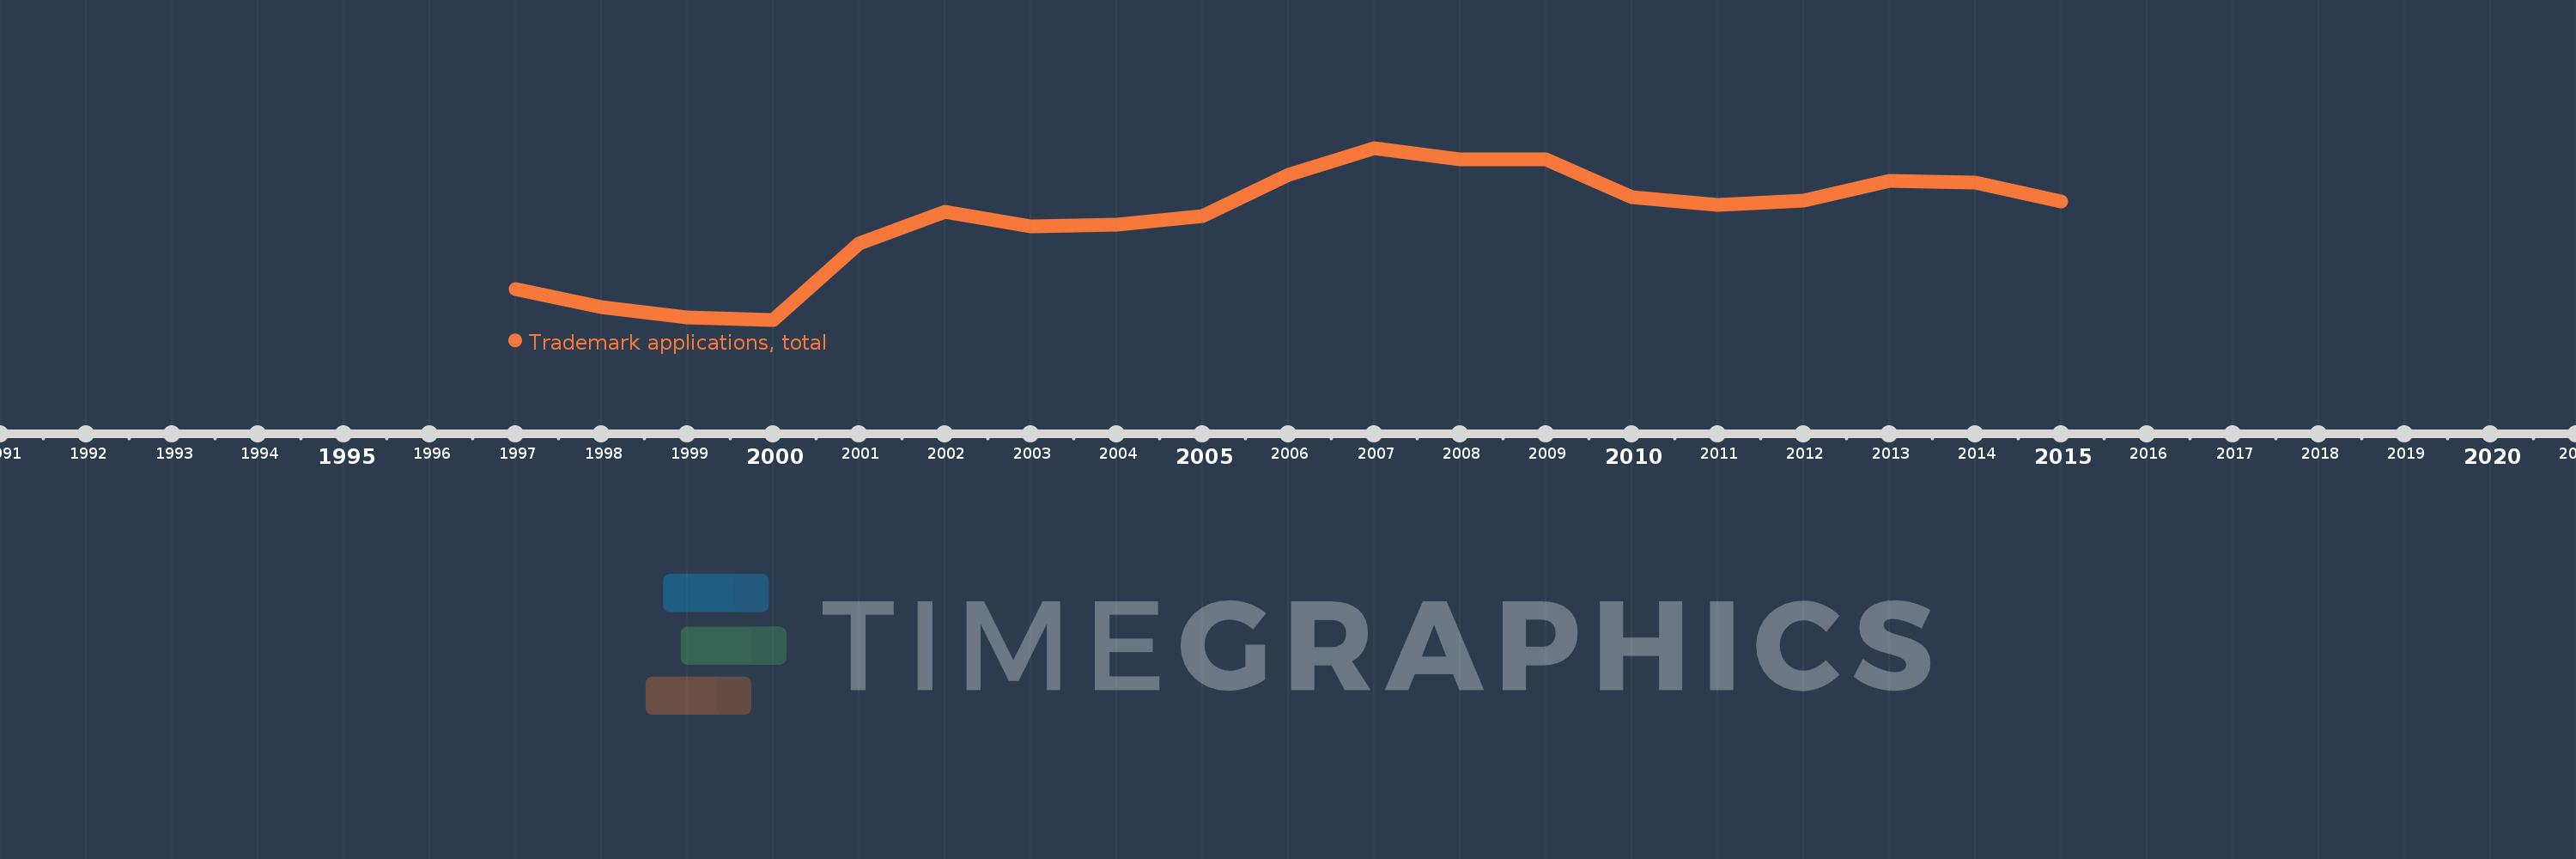
This timeline shows a graph from 1997 to 2015 of Turkmenistan. No data until 1996. Number of actual observations by date: 19.
Source name:
World Development Indicators
Source organization:
World Intellectual Property Organization (WIPO), World Intellectual Property Indicators and www.wipo.int/econ_stat. The International Bureau of WIPO assumes no responsibility with respect to the transformation of these data.
Categories, topics:
Science & Technology
Last updated:
apr 23, 2017
Indicators value changes by year
Meaning:
2.061K
Minimum:
787.0
jan 1, 2000
Maximum:
2.963K
jan 1, 2007
At the date of observation
Value
Absolute change
Change from the previous value
jan 1, 1997
1.176K
+1.176K
0.0%
jan 1, 1998
952.0
-224.0
-19.05%
jan 1, 1999
815.0
-137.0
-14.39%
jan 1, 2000
787.0
-28.0
-3.44%
jan 1, 2001
1.748K
+961.0
122.11%
jan 1, 2002
2.157K
+409.0
23.4%
jan 1, 2003
1.972K
-185.0
-8.58%
jan 1, 2004
1.989K
+17.0
0.86%
jan 1, 2005
2.1K
+111.0
5.58%
jan 1, 2006
2.627K
+527.0
25.1%
jan 1, 2007
2.963K
+336.0
12.79%
jan 1, 2008
2.821K
-142.0
-4.79%
jan 1, 2009
2.819K
-2.0
-0.07%
jan 1, 2010
2.337K
-482.0
-17.1%
jan 1, 2011
2.245K
-92.0
-3.94%
jan 1, 2012
2.293K
+48.0
2.14%
jan 1, 2013
2.549K
+256.0
11.16%
jan 1, 2014
2.529K
-20.0
-0.78%
jan 1, 2015
2.283K
-246.0
-9.73%
Ranking of countries by current statistics by years