29
/
en
AIzaSyAYiBZKx7MnpbEhh9jyipgxe19OcubqV5w
April 1, 2024
184682
Macedonia, FYR
MKD
true
2
1
Trademark applications, total
2015,2014,2013,2012,2011,2010,2009,2008,2007,2006,2005,2004,2003,2002,2001,2000,1999,1998,1997,1996,1995,1994
Download
Global statistics library →Macedonia, FYR →

Trademark applications, total

This statistics in other country:
AlbaniaAlgeriaAndorraAngolaAntigua and BarbudaArab WorldArgentinaArmeniaArubaAustraliaAustriaAzerbaijanBahamas, TheBahrainBangladeshBarbadosBelarusBelgiumBelizeBhutanBoliviaBosnia and HerzegovinaBotswanaBrazilBrunei DarussalamBulgariaBurkina FasoBurundiCabo VerdeCambodiaCanadaCaribbean small statesCentral Europe and the BalticsChileChinaColombiaComorosCongo, Dem. Rep.Costa RicaCroatiaCubaCuracaoCyprusCzech RepublicDenmarkDjiboutiDominicaDominican RepublicEarly-demographic dividendEast Asia & PacificEast Asia & Pacific (excluding high income)East Asia & Pacific (IDA & IBRD countries)EcuadorEgypt, Arab Rep.El SalvadorEquatorial GuineaEstoniaEthiopiaEuro areaEurope & Central AsiaEurope & Central Asia (excluding high income)Europe & Central Asia (IDA & IBRD countries)European UnionFijiFinlandFranceGambia, TheGeorgiaGermanyGhanaGreeceGrenadaGuatemalaGuineaGuinea-BissauGuyanaHaitiHigh incomeHondurasHong Kong SAR, ChinaHungaryIBRD onlyIcelandIDA & IBRD totalIDA blendIDA onlyIDA totalIndiaIndonesiaIran, Islamic Rep.IraqIrelandIsraelItalyJamaicaJapanJordanKazakhstanKenyaKiribatiKorea, Dem. People’s Rep.Korea, Rep.KuwaitKyrgyz RepublicLao PDRLate-demographic dividendLatin America & Caribbean Latin America & Caribbean (excluding high income)Latin America & the Caribbean (IDA & IBRD countries)LatviaLeast developed countries: UN classificationLebanonLesothoLiberiaLibyaLiechtensteinLithuaniaLow & middle incomeLower middle incomeLuxembourgMacao SAR, ChinaMacedonia, FYRMadagascarMalawiMalaysiaMaldivesMaliMaltaMauritiusMexicoMiddle East & North AfricaMiddle East & North Africa (excluding high income)Middle East & North Africa (IDA & IBRD countries)Middle incomeMoldovaMonacoMongoliaMontenegroMoroccoMozambiqueMyanmarNamibiaNepalNetherlandsNew ZealandNicaraguaNigeriaNorth AmericaNorwayOECD membersOmanOther small statesPacific island small statesPakistanPanamaPapua New GuineaParaguayPeruPhilippinesPolandPortugalPost-demographic dividendQatarRomaniaRussian FederationRwandaSamoaSan MarinoSao Tome and PrincipeSaudi ArabiaSerbiaSeychellesSierra LeoneSingaporeSint Maarten (Dutch part)Slovak RepublicSloveniaSmall statesSolomon IslandsSomaliaSouth AfricaSouth AsiaSouth Asia (IDA & IBRD)SpainSri LankaSt. LuciaSt. Vincent and the GrenadinesSudanSurinameSwazilandSwedenSwitzerlandSyrian Arab RepublicTajikistanTanzaniaThailandTongaTrinidad and TobagoTunisiaTurkeyTurkmenistanTuvaluUgandaUkraineUnited Arab EmiratesUnited KingdomUnited StatesUpper middle incomeUruguayUzbekistanVenezuela, RBVietnamWorldYemen, Rep.ZambiaZimbabwe
Timeline:
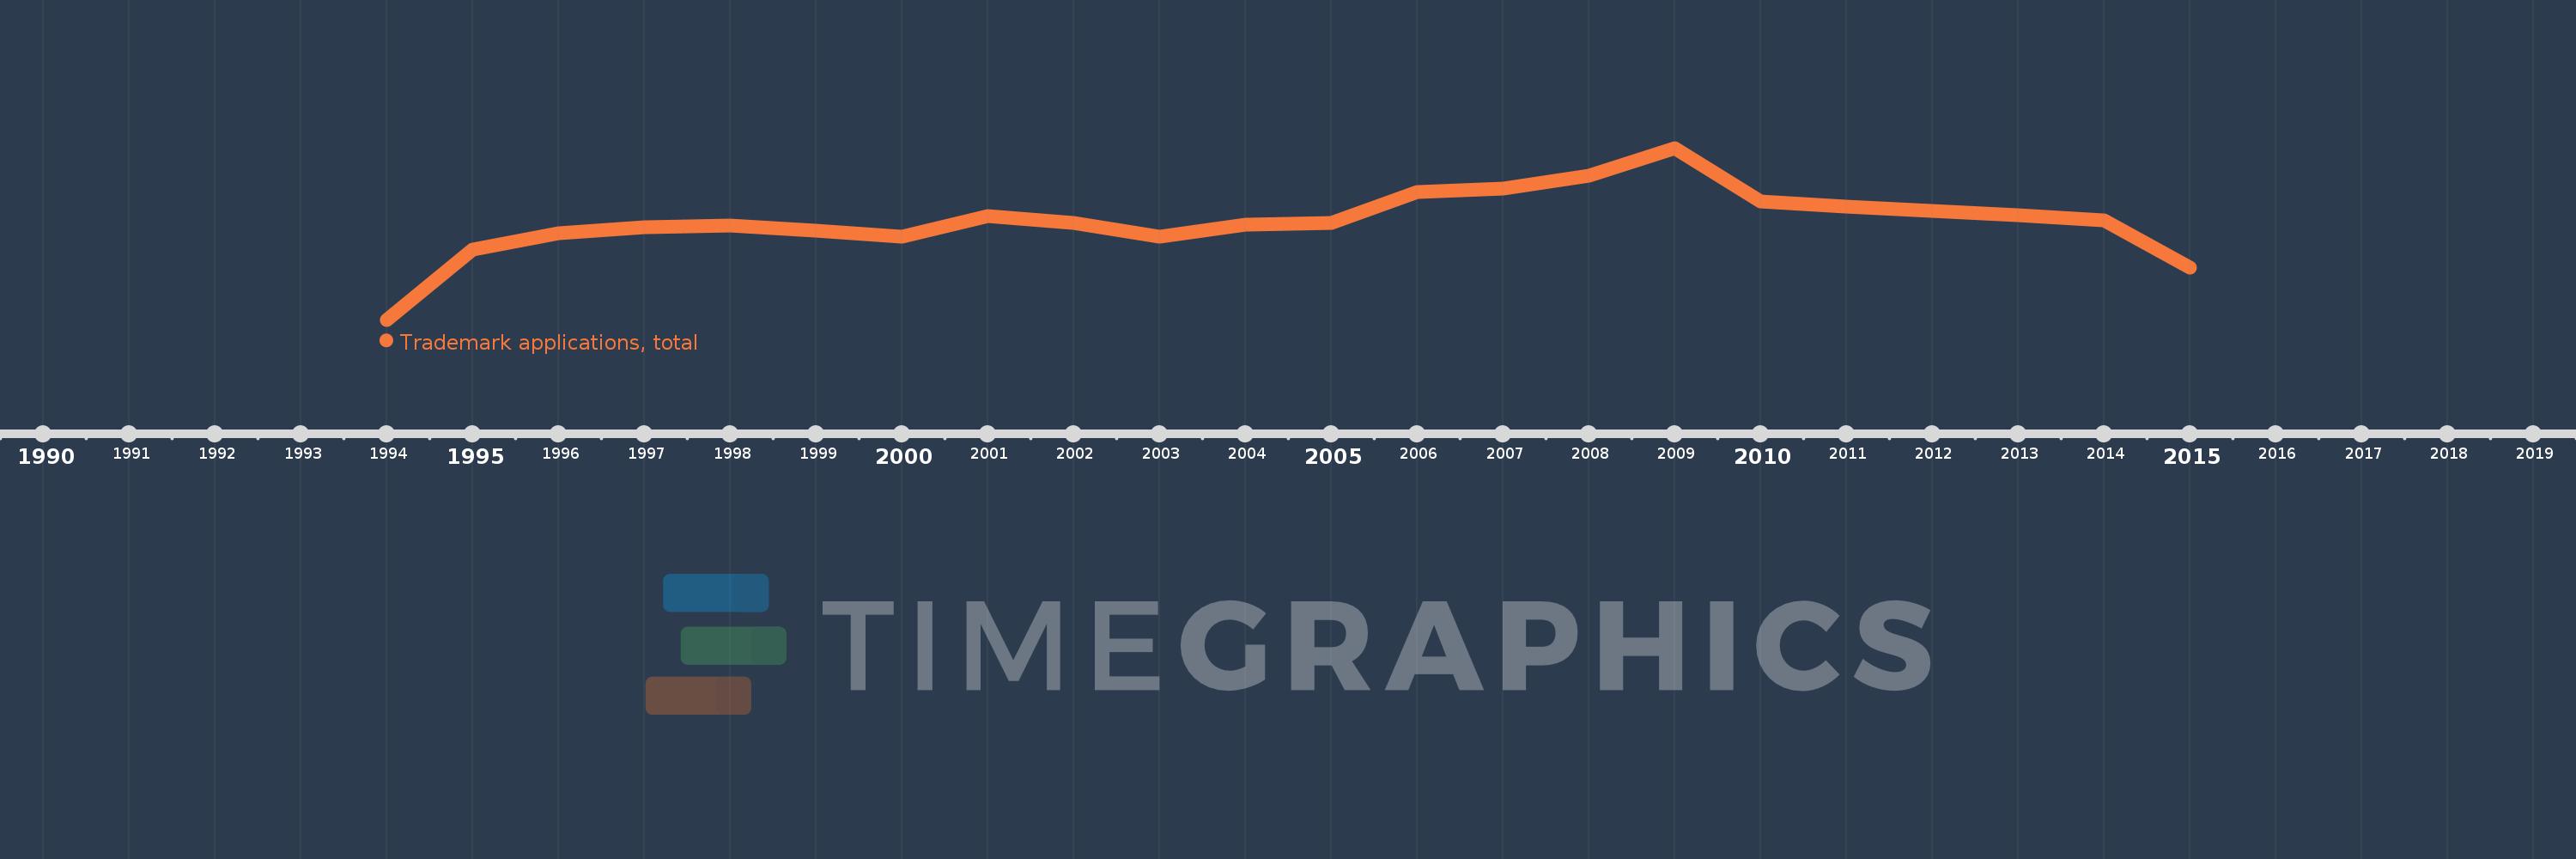
This timeline shows a graph from 1994 to 2015 of Macedonia, FYR. No data until 1993. Number of actual observations by date: 22.
Source name:
World Development Indicators
Source organization:
World Intellectual Property Organization (WIPO), World Intellectual Property Indicators and www.wipo.int/econ_stat. The International Bureau of WIPO assumes no responsibility with respect to the transformation of these data.
Categories, topics:
Science & Technology
Last updated:
apr 23, 2017
Indicators value changes by year
Mean:
4.44K
Minimum:
1.209K
jan 1, 1994
Maximum:
6.856K
jan 1, 2009
At the date of observation
Value
Absolute change
Change from previous value
jan 1, 1994
1.209K
+1.209K
0.0%
jan 1, 1995
3.503K
+2.294K
189.74%
jan 1, 1996
4.052K
+549.0
15.67%
jan 1, 1997
4.244K
+192.0
4.74%
jan 1, 1998
4.304K
+60.0
1.41%
jan 1, 1999
4.139K
-165.0
-3.83%
jan 1, 2000
3.926K
-213.0
-5.15%
jan 1, 2001
4.631K
+705.0
17.96%
jan 1, 2002
4.402K
-229.0
-4.94%
jan 1, 2003
3.952K
-450.0
-10.22%
jan 1, 2004
4.346K
+394.0
9.97%
jan 1, 2005
4.402K
+56.0
1.29%
jan 1, 2006
5.397K
+995.0
22.6%
jan 1, 2007
5.515K
+118.0
2.19%
jan 1, 2008
5.951K
+436.0
7.91%
jan 1, 2009
6.856K
+905.0
15.21%
jan 1, 2010
5.084K
-1.772K
-25.85%
jan 1, 2011
4.917K
-167.0
-3.28%
jan 1, 2012
4.78K
-137.0
-2.79%
jan 1, 2013
4.654K
-126.0
-2.64%
jan 1, 2014
4.478K
-176.0
-3.78%
jan 1, 2015
2.931K
-1.547K
-34.55%
Ranking of countries by current statistics by years

Comments:

Send
PremiumAbout & FeedbackTermsPrivacy
logo
© 2022 Selected Technologies LLC – Morgan Hill, California