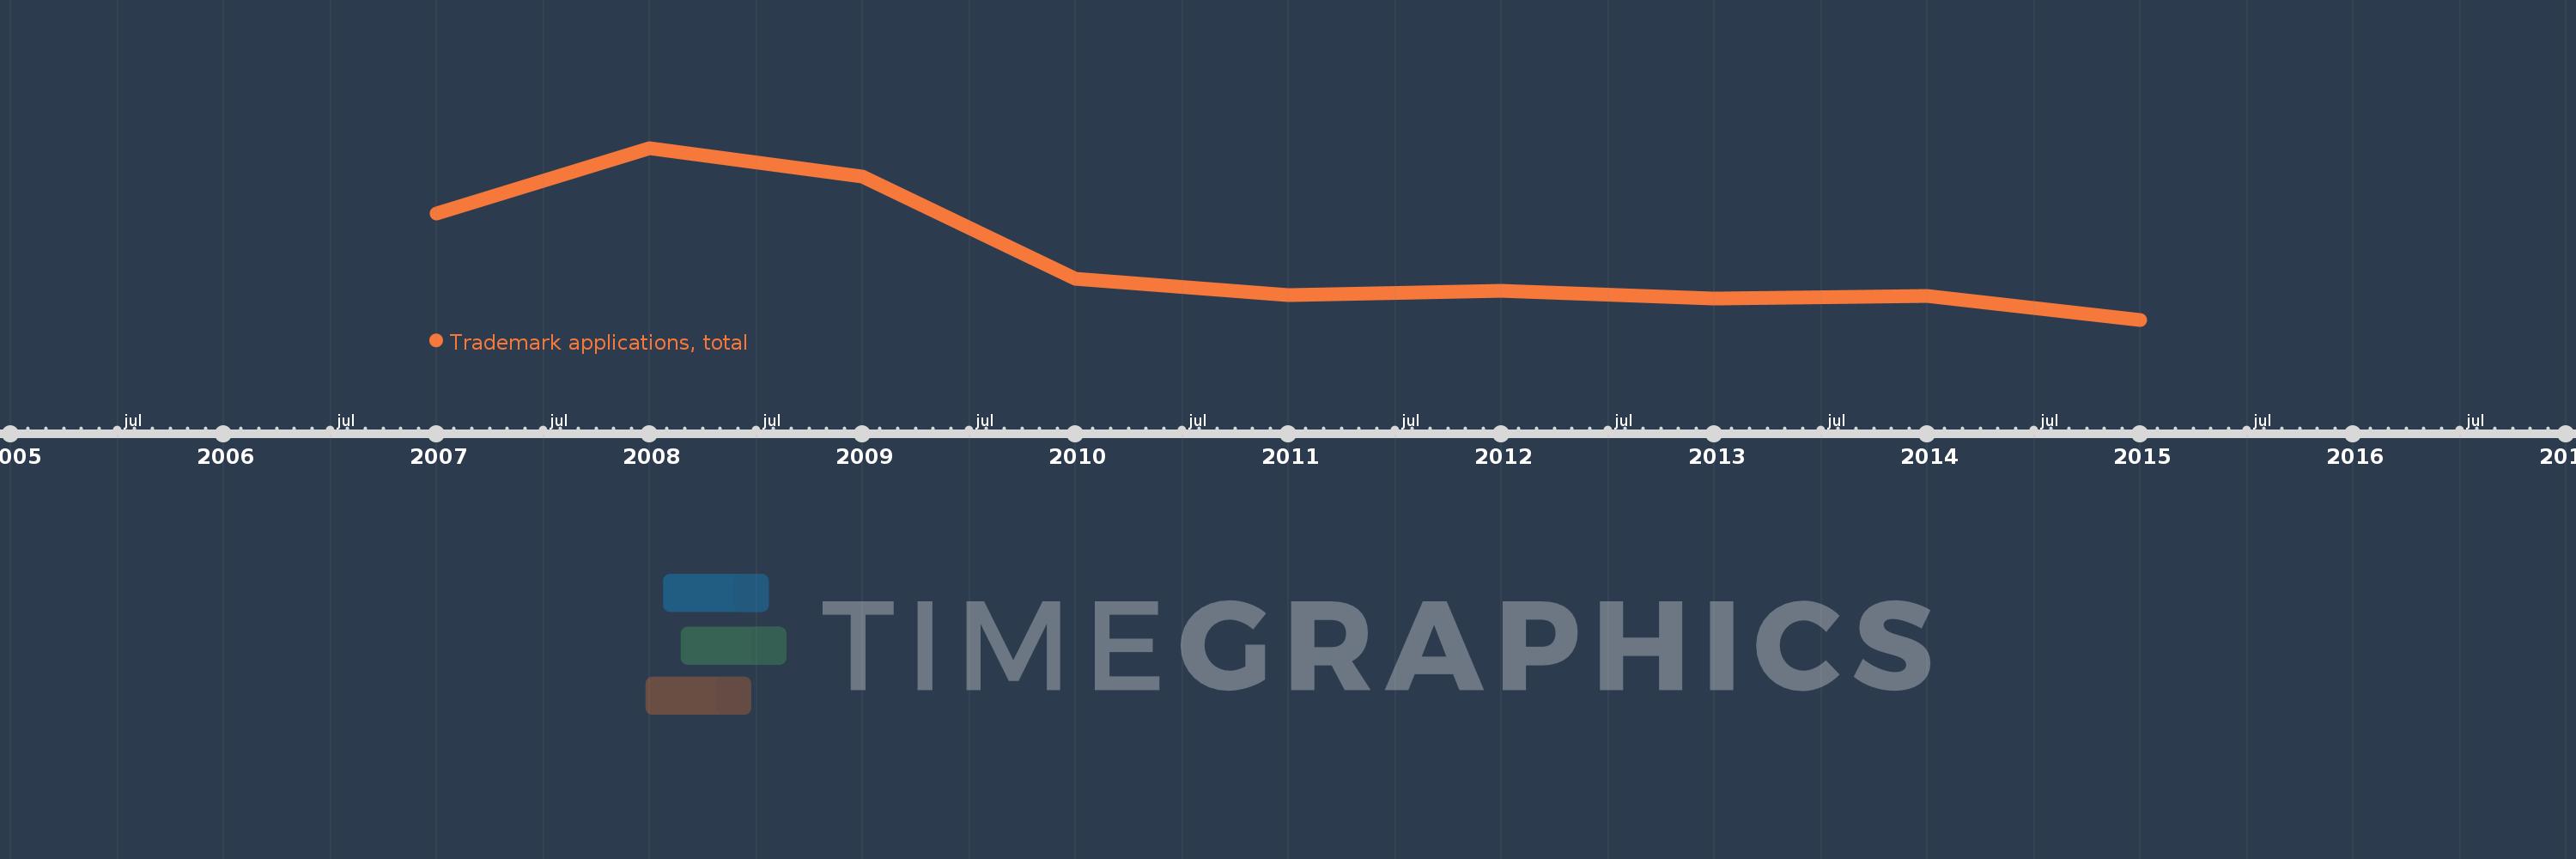
This timeline shows a graph from 2007 to 2015 of Serbia. No data until 2006. Number of actual observations by date: 9.
Source name:
World Development Indicators
Source organization:
World Intellectual Property Organization (WIPO), World Intellectual Property Indicators and www.wipo.int/econ_stat. The International Bureau of WIPO assumes no responsibility with respect to the transformation of these data.
Categories, topics:
Science & Technology
Last updated:
apr 23, 2017
Indicators value changes by year
Meaning:
7.708K
Minimum:
6.345K
jan 1, 2015
Maximum:
10.096K
jan 1, 2008
At the date of observation
Value
Absolute change
Change from the previous value
jan 1, 2007
8.666K
+8.666K
0.0%
jan 1, 2008
10.096K
+1.43K
16.5%
jan 1, 2009
9.479K
-617.0
-6.11%
jan 1, 2010
7.237K
-2.242K
-23.65%
jan 1, 2011
6.885K
-352.0
-4.86%
jan 1, 2012
6.979K
+94.0
1.37%
jan 1, 2013
6.815K
-164.0
-2.35%
jan 1, 2014
6.869K
+54.0
0.79%
jan 1, 2015
6.345K
-524.0
-7.63%
Ranking of countries by current statistics by years