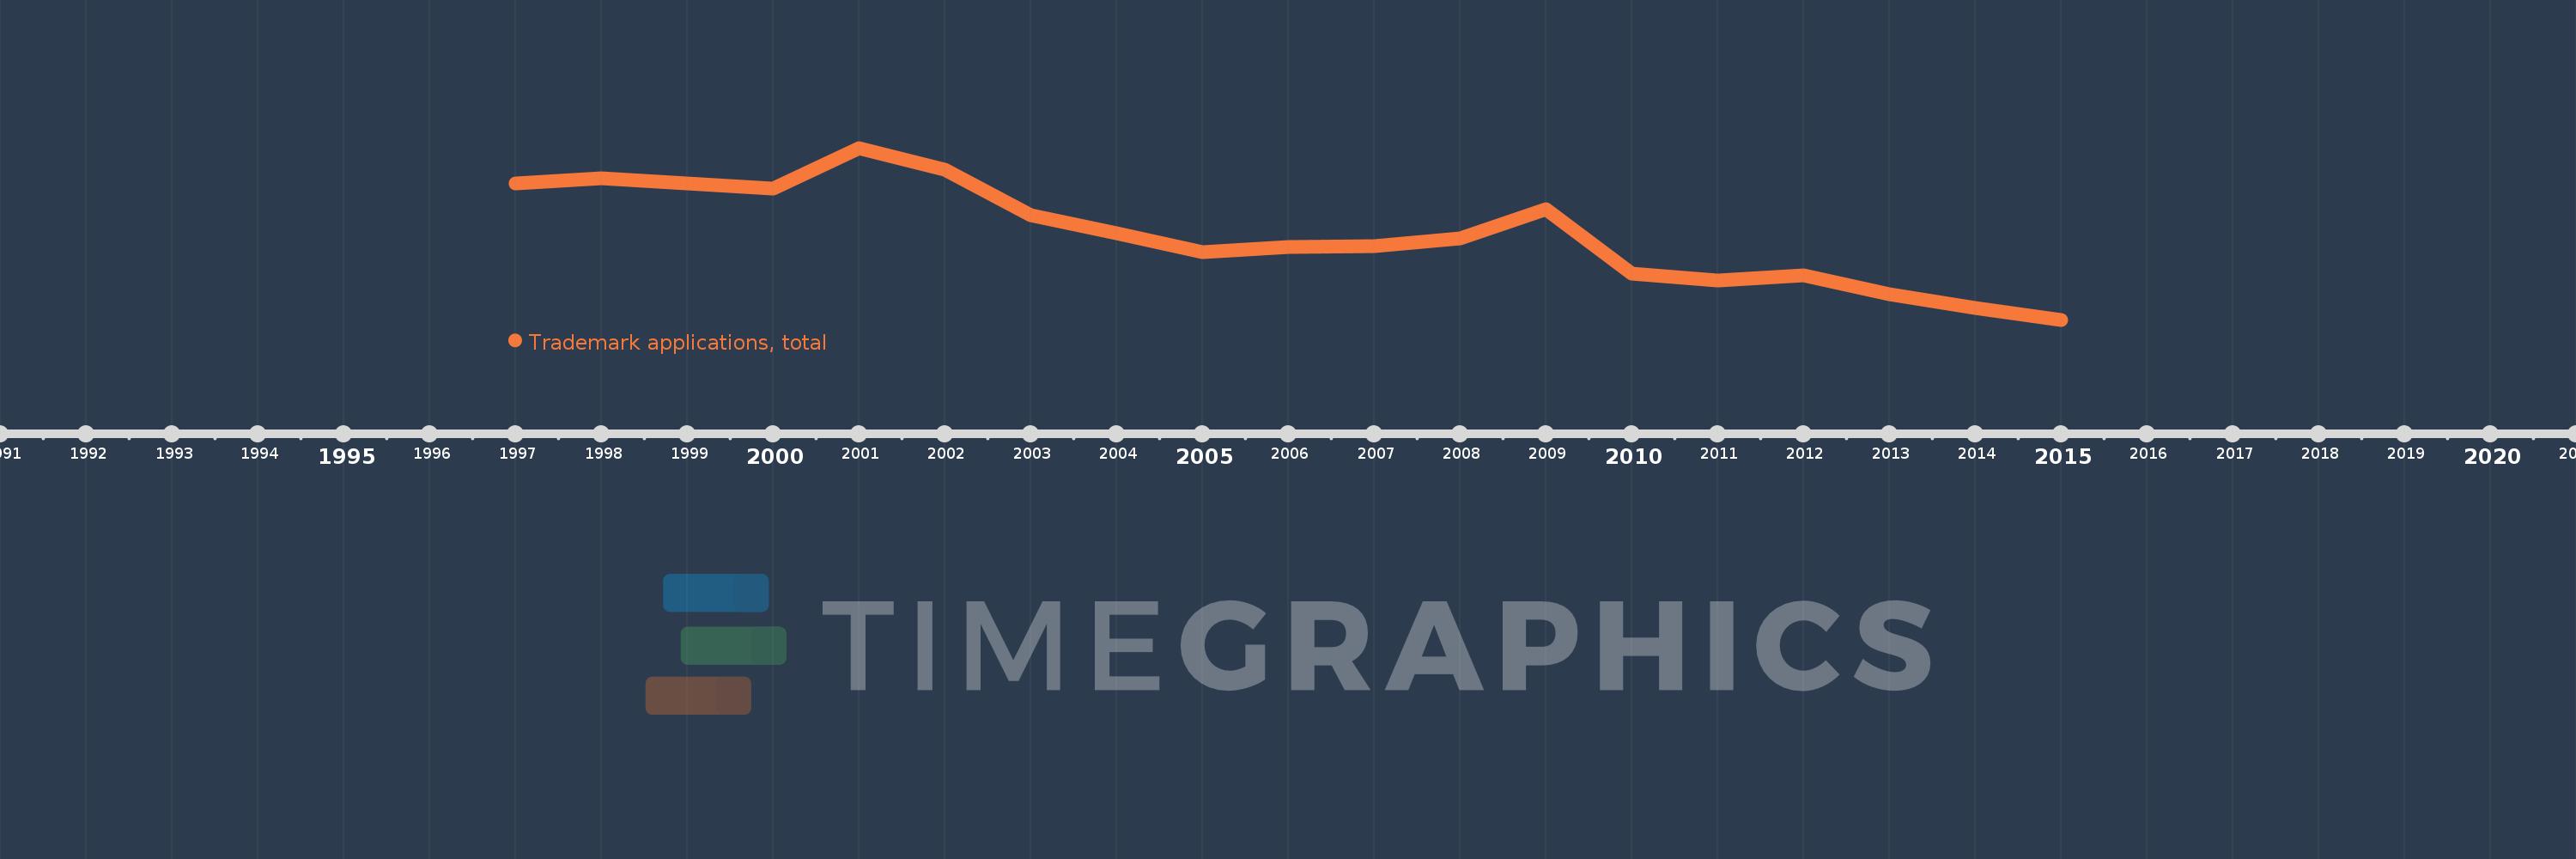
This timeline shows a graph from 1997 to 2015 of San Marino. No data until 1996. Number of actual observations by date: 19.
Source name:
World Development Indicators
Source organization:
World Intellectual Property Organization (WIPO), World Intellectual Property Indicators and www.wipo.int/econ_stat. The International Bureau of WIPO assumes no responsibility with respect to the transformation of these data.
Categories, topics:
Science & Technology
Last updated:
apr 23, 2017
Indicators value changes by year
Meaning:
1.822K
Minimum:
1.009K
jan 1, 2015
Maximum:
2.636K
jan 1, 2001
At the date of observation
Value
Absolute change
Change from the previous value
jan 1, 1997
2.304K
+2.304K
0.0%
jan 1, 1998
2.352K
+48.0
2.08%
jan 1, 1999
2.299K
-53.0
-2.25%
jan 1, 2000
2.249K
-50.0
-2.17%
jan 1, 2001
2.636K
+387.0
17.21%
jan 1, 2002
2.429K
-207.0
-7.85%
jan 1, 2003
2.002K
-427.0
-17.58%
jan 1, 2004
1.83K
-172.0
-8.59%
jan 1, 2005
1.65K
-180.0
-9.84%
jan 1, 2006
1.701K
+51.0
3.09%
jan 1, 2007
1.707K
+6.0
0.35%
jan 1, 2008
1.777K
+70.0
4.1%
jan 1, 2009
2.058K
+281.0
15.81%
jan 1, 2010
1.443K
-615.0
-29.88%
jan 1, 2011
1.378K
-65.0
-4.5%
jan 1, 2012
1.428K
+50.0
3.63%
jan 1, 2013
1.247K
-181.0
-12.68%
jan 1, 2014
1.124K
-123.0
-9.86%
jan 1, 2015
1.009K
-115.0
-10.23%
Ranking of countries by current statistics by years