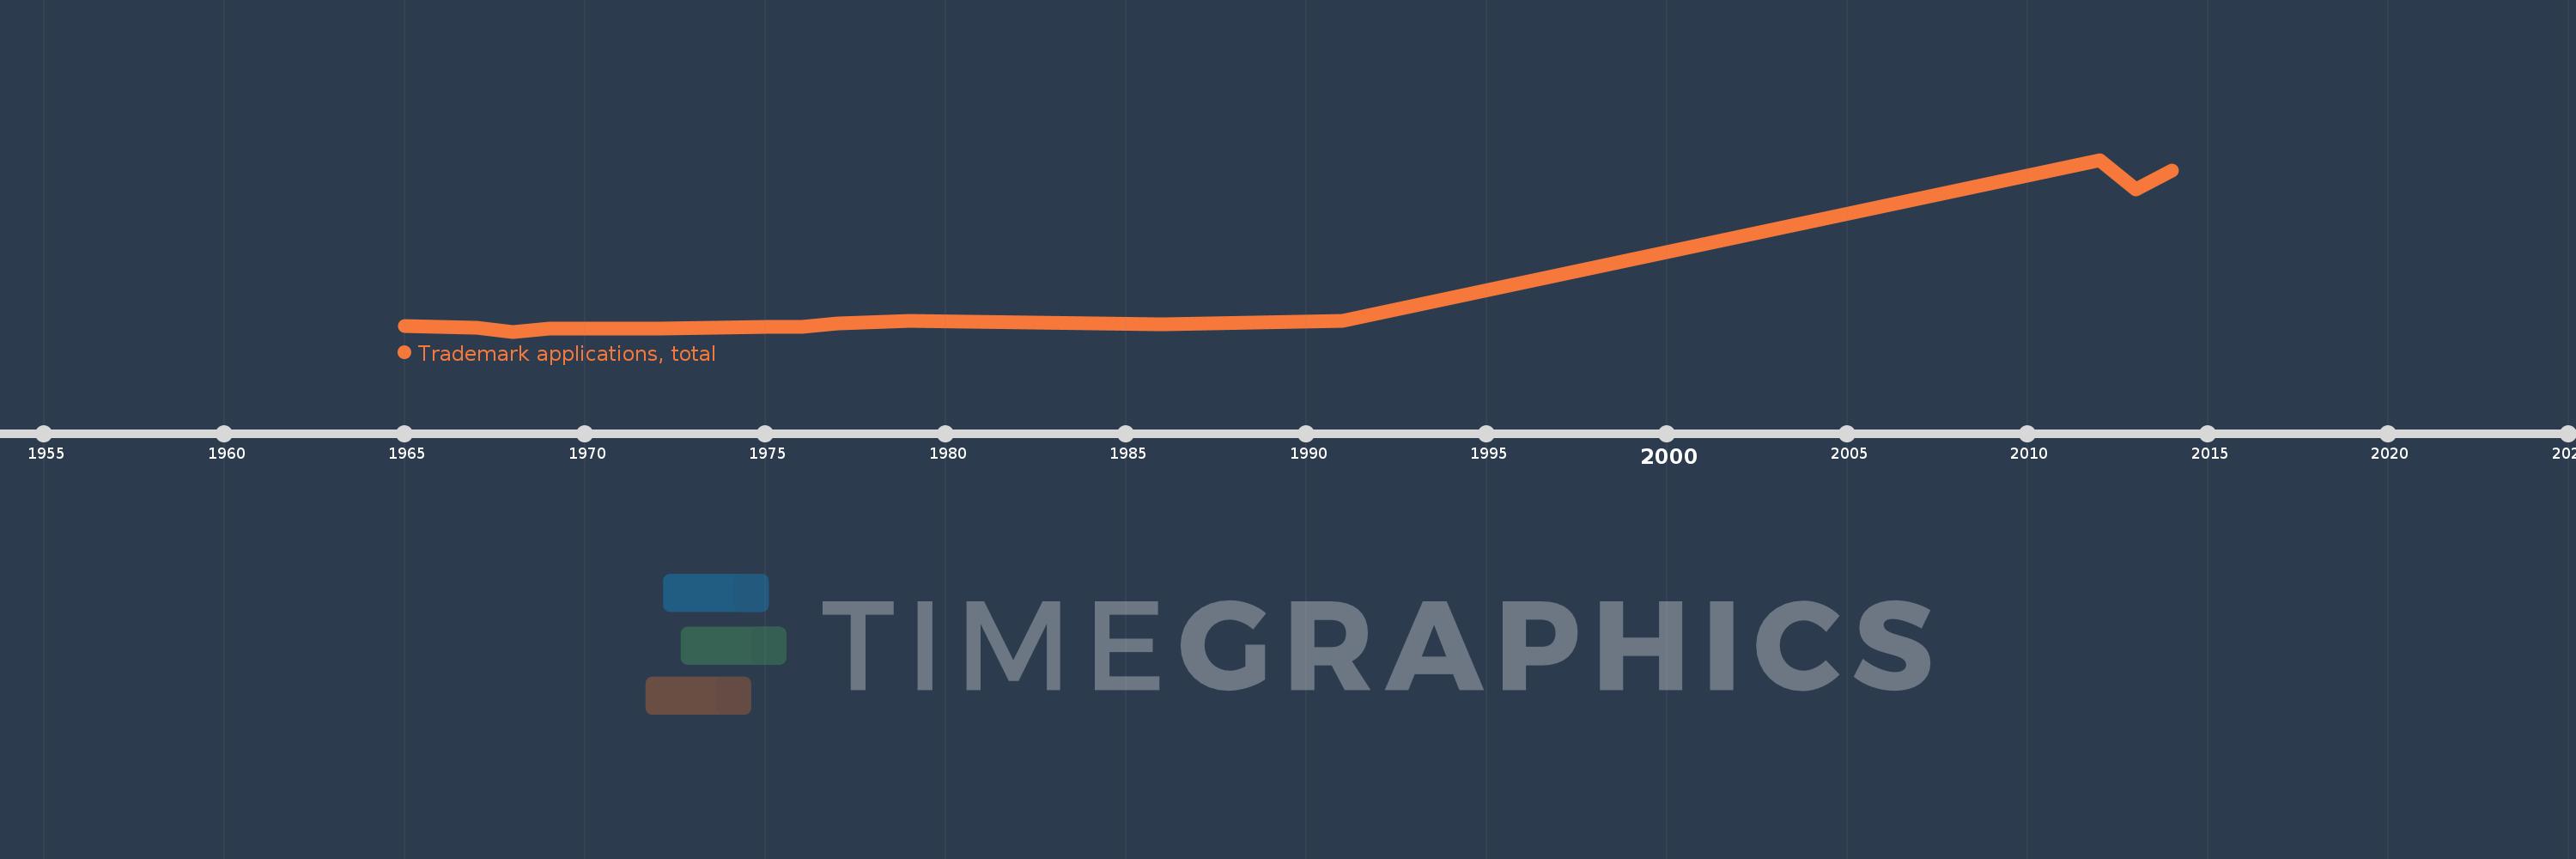
This timeline shows a graph from 1965 to 2014 of Nigeria. No data until 1964. Number of actual observations by date: 15.
Source name:
World Development Indicators
Source organization:
World Intellectual Property Organization (WIPO), World Intellectual Property Indicators and www.wipo.int/econ_stat. The International Bureau of WIPO assumes no responsibility with respect to the transformation of these data.
Categories, topics:
Science & Technology
Last updated:
apr 23, 2017
Indicators value changes by year
Meaning:
4.943K
Minimum:
814.0
jan 1, 1968
Maximum:
20.56K
jan 1, 2012
At the date of observation
Value
Absolute change
Change from the previous value
jan 1, 1965
1.443K
+1.443K
0.0%
jan 1, 1967
1.262K
-181.0
-12.54%
jan 1, 1968
814.0
-448.0
-35.5%
jan 1, 1969
1.13K
+316.0
38.82%
jan 1, 1971
1.139K
+9.0
0.8%
jan 1, 1972
1.163K
+24.0
2.11%
jan 1, 1975
1.393K
+230.0
19.78%
jan 1, 1976
1.346K
-47.0
-3.37%
jan 1, 1977
1.722K
+376.0
27.93%
jan 1, 1979
2.021K
+299.0
17.36%
jan 1, 1986
1.631K
-390.0
-19.3%
jan 1, 1991
2.006K
+375.0
22.99%
jan 1, 2012
20.56K
+18.554K
924.93%
jan 1, 2013
17.182K
-3.378K
-16.43%
jan 1, 2014
19.332K
+2.15K
12.51%
Ranking of countries by current statistics by years