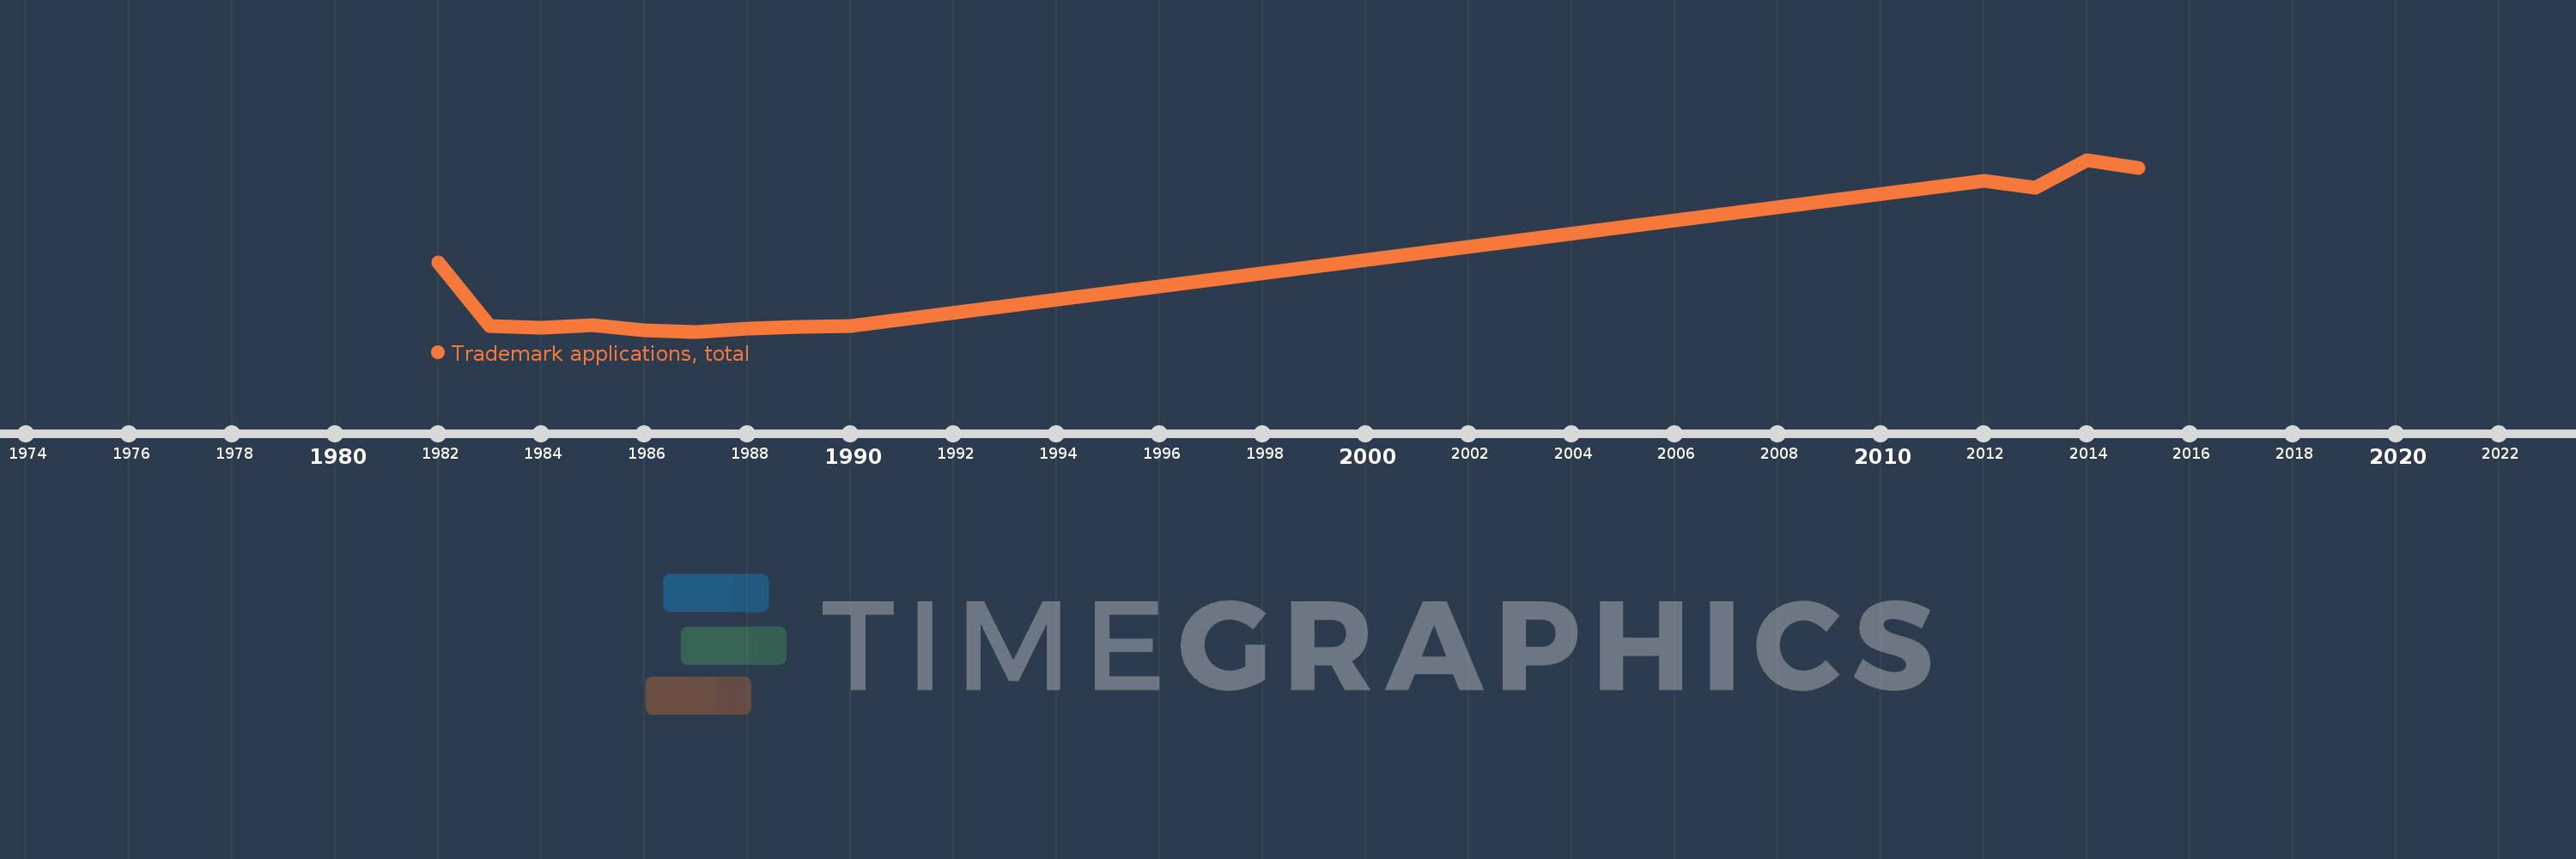
This timeline shows a graph from 1982 to 2015 of Qatar. No data until 1981. Number of actual observations by date: 13.
Source name:
World Development Indicators
Source organization:
World Intellectual Property Organization (WIPO), World Intellectual Property Indicators and www.wipo.int/econ_stat. The International Bureau of WIPO assumes no responsibility with respect to the transformation of these data.
Categories, topics:
Science & Technology
Last updated:
apr 23, 2017
Indicators value changes by year
Meaning:
2.93K
Minimum:
484.0
jan 1, 1987
Maximum:
7.979K
jan 1, 2014
At the date of observation
Value
Absolute change
Change from the previous value
jan 1, 1982
3.489K
+3.489K
0.0%
jan 1, 1983
739.0
-2.75K
-78.82%
jan 1, 1984
646.0
-93.0
-12.58%
jan 1, 1985
752.0
+106.0
16.41%
jan 1, 1986
542.0
-210.0
-27.93%
jan 1, 1987
484.0
-58.0
-10.7%
jan 1, 1988
606.0
+122.0
25.21%
jan 1, 1989
707.0
+101.0
16.67%
jan 1, 1990
721.0
+14.0
1.98%
jan 1, 2012
7.043K
+6.322K
876.84%
jan 1, 2013
6.773K
-270.0
-3.83%
jan 1, 2014
7.979K
+1.206K
17.81%
jan 1, 2015
7.608K
-371.0
-4.65%
Ranking of countries by current statistics by years