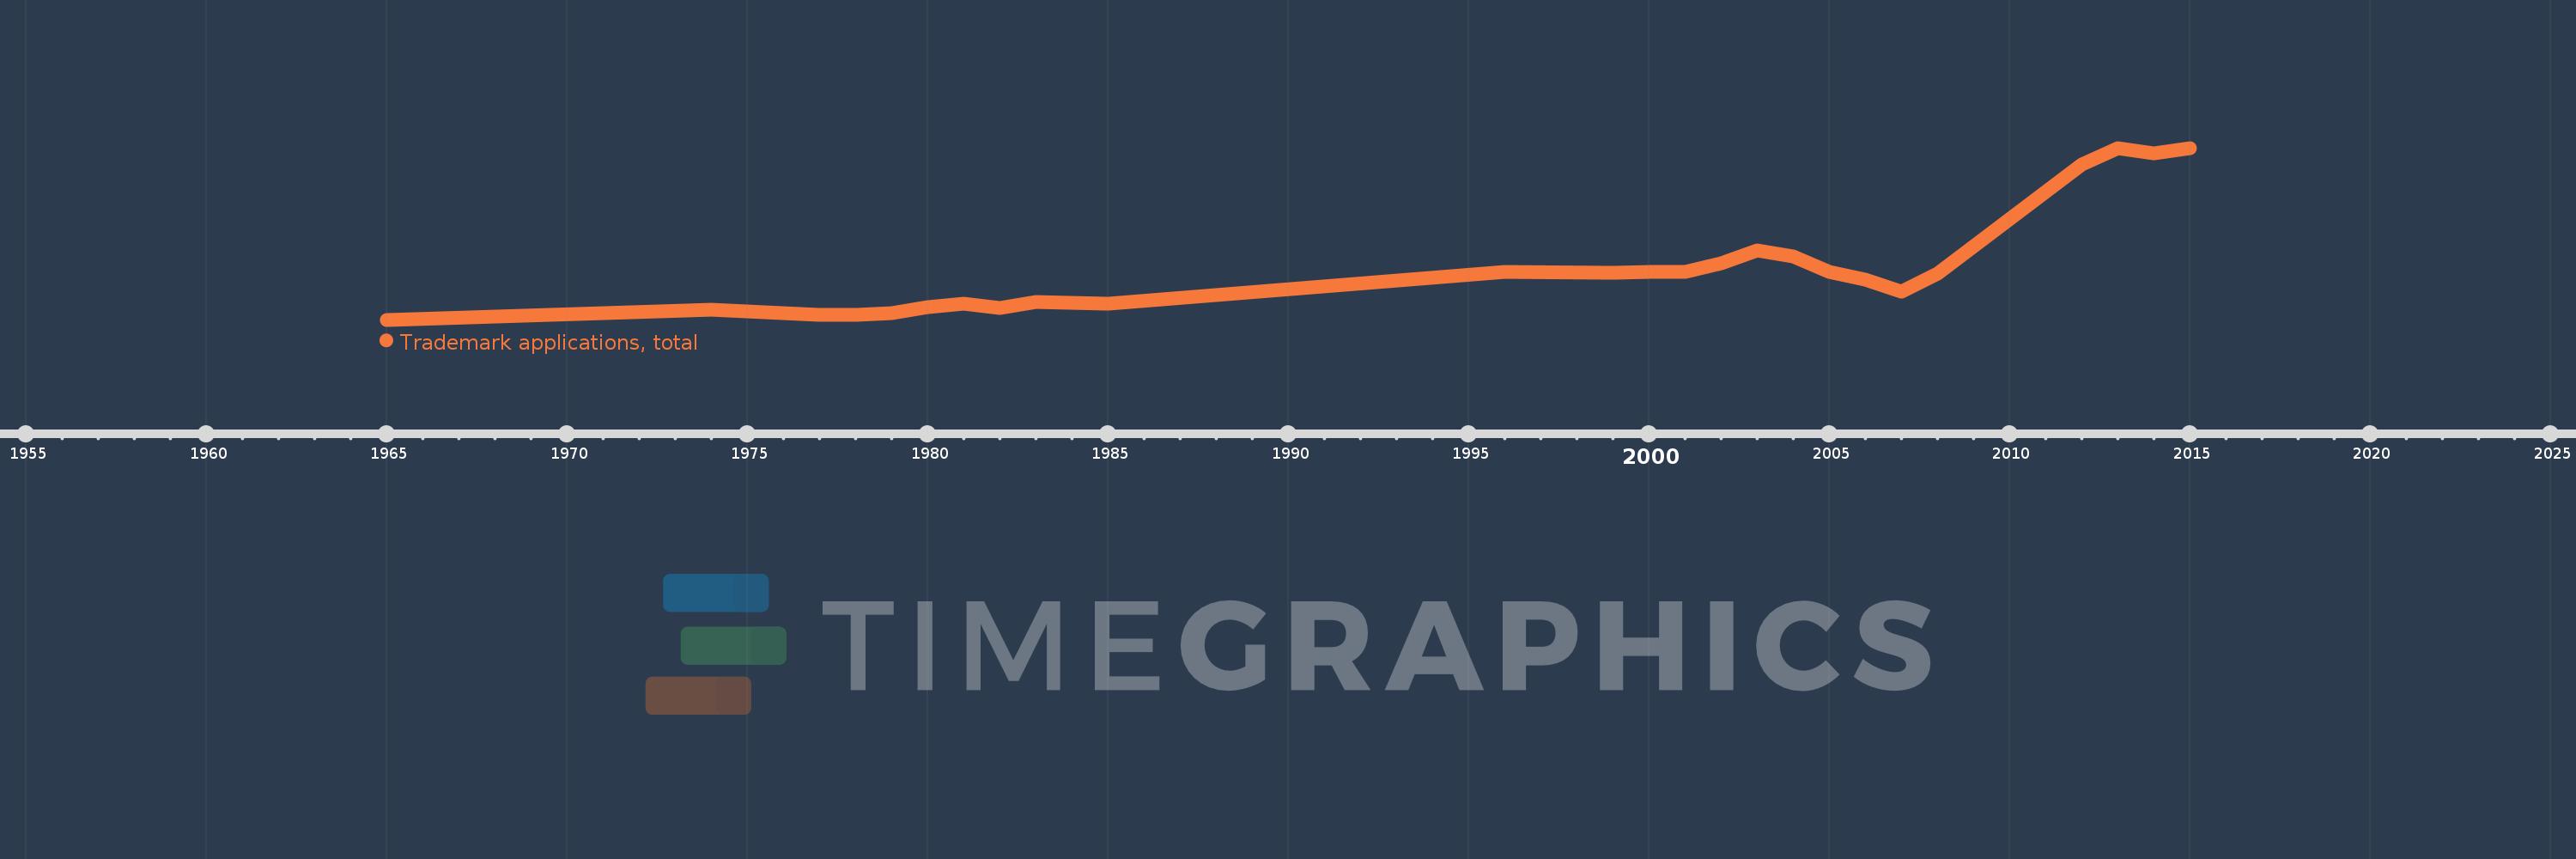
This timeline shows a graph from 1965 to 2015 of Nepal. No data until 1964. Number of actual observations by date: 25.
Source name:
World Development Indicators
Source organization:
World Intellectual Property Organization (WIPO), World Intellectual Property Indicators and www.wipo.int/econ_stat. The International Bureau of WIPO assumes no responsibility with respect to the transformation of these data.
Categories, topics:
Science & Technology
Last updated:
apr 23, 2017
Indicators value changes by year
Meaning:
1.271K
Minimum:
96.0
jan 1, 1965
Maximum:
3.961K
jan 1, 2013
At the date of observation
Value
Absolute change
Change from the previous value
jan 1, 1965
96.0
+96.0
0.0%
jan 1, 1974
330.0
+234.0
243.75%
jan 1, 1977
207.0
-123.0
-37.27%
jan 1, 1978
214.0
+7.0
3.38%
jan 1, 1979
242.0
+28.0
13.08%
jan 1, 1980
375.0
+133.0
54.96%
jan 1, 1981
466.0
+91.0
24.27%
jan 1, 1982
352.0
-114.0
-24.46%
jan 1, 1983
487.0
+135.0
38.35%
jan 1, 1985
457.0
-30.0
-6.16%
jan 1, 1996
1.167K
+710.0
155.36%
jan 1, 1999
1.159K
-8.0
-0.69%
jan 1, 2000
1.163K
+4.0
0.35%
jan 1, 2001
1.175K
+12.0
1.03%
jan 1, 2002
1.361K
+186.0
15.83%
jan 1, 2003
1.651K
+290.0
21.31%
jan 1, 2004
1.516K
-135.0
-8.18%
jan 1, 2005
1.174K
-342.0
-22.56%
jan 1, 2006
1.004K
-170.0
-14.48%
jan 1, 2007
723.0
-281.0
-27.99%
jan 1, 2008
1.132K
+409.0
56.57%
jan 1, 2012
3.583K
+2.451K
216.52%
jan 1, 2013
3.961K
+378.0
10.55%
jan 1, 2014
3.832K
-129.0
-3.26%
jan 1, 2015
3.95K
+118.0
3.08%
Ranking of countries by current statistics by years