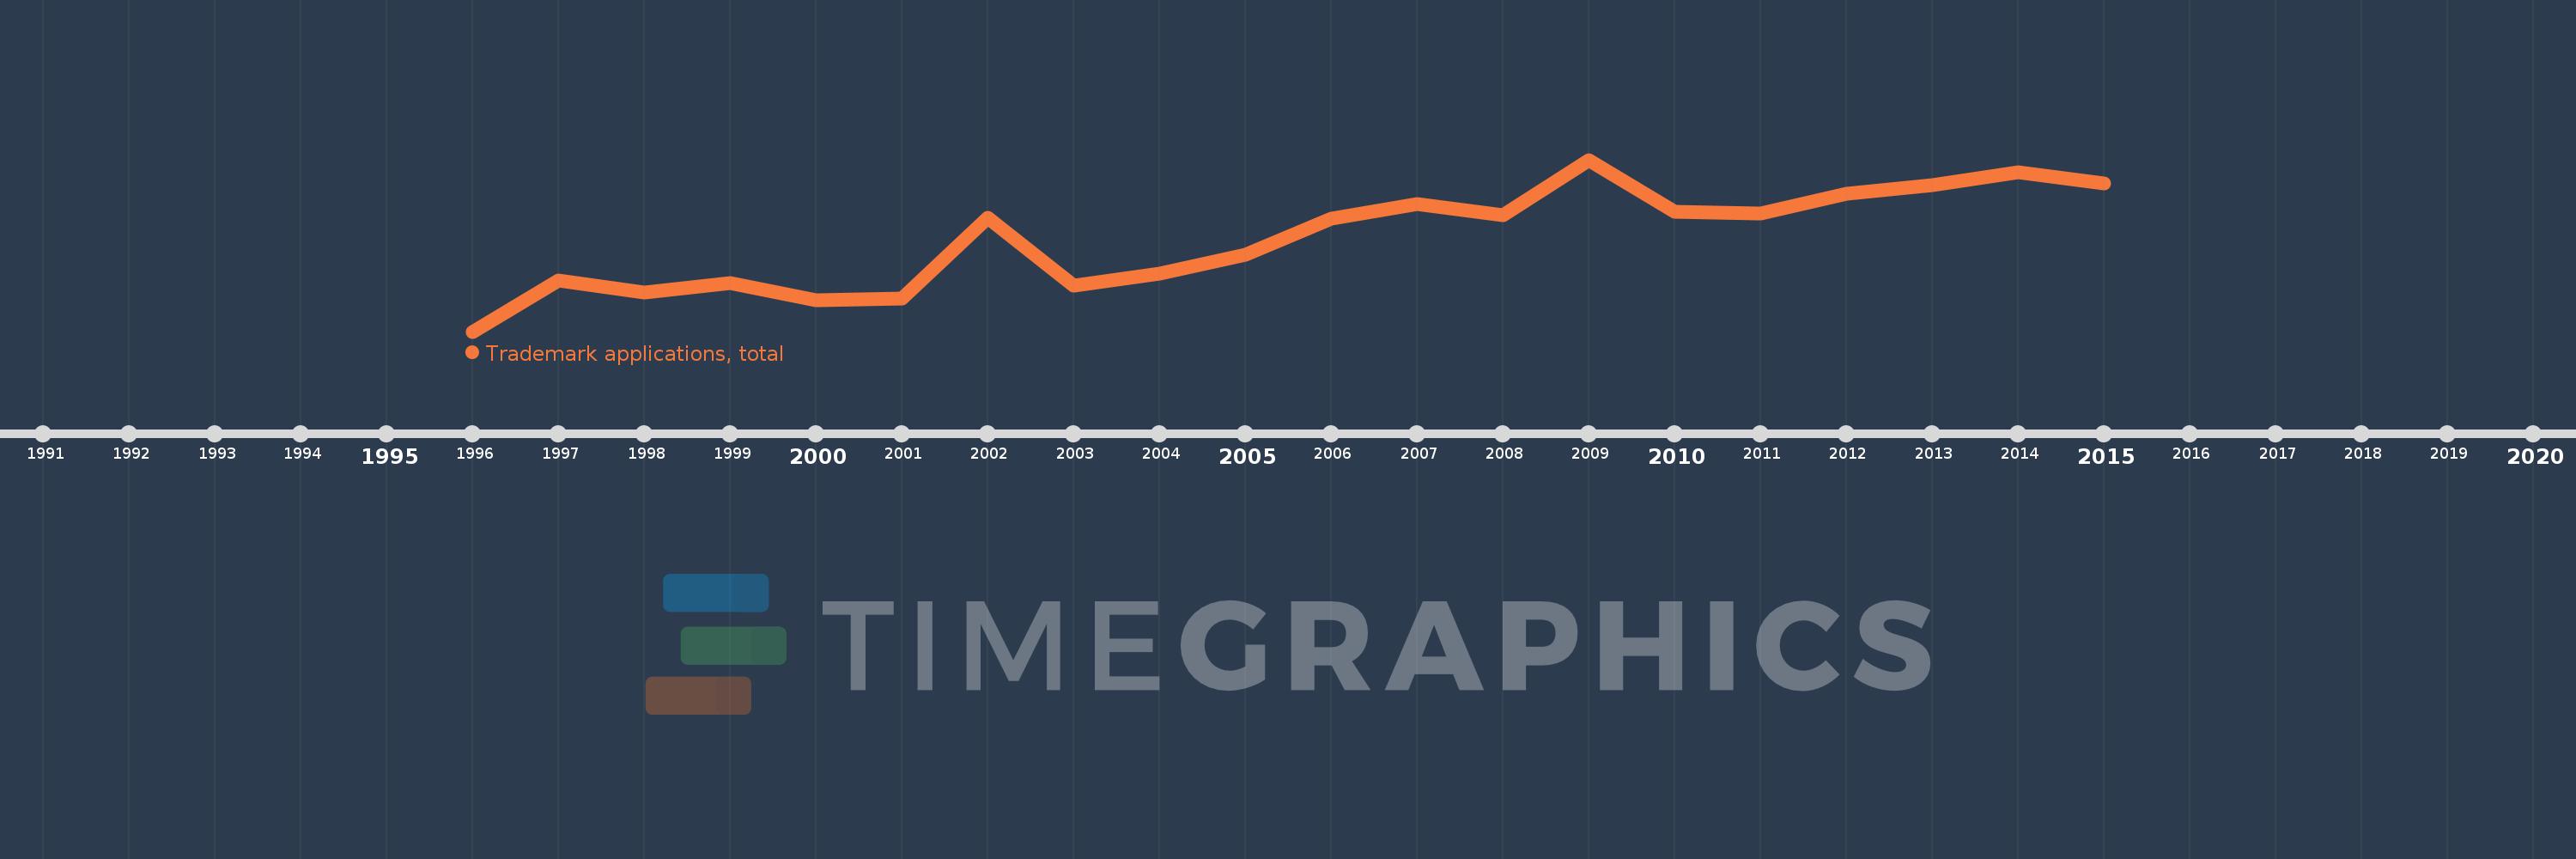
This timeline shows a graph from 1996 to 2015 of Azerbaijan. No data until 1995. Number of actual observations by date: 20.
Source name:
World Development Indicators
Source organization:
World Intellectual Property Organization (WIPO), World Intellectual Property Indicators and www.wipo.int/econ_stat. The International Bureau of WIPO assumes no responsibility with respect to the transformation of these data.
Categories, topics:
Science & Technology
Last updated:
apr 23, 2017
Indicators value changes by year
Meaning:
4.032K
Minimum:
1.088K
jan 1, 1996
Maximum:
6.535K
jan 1, 2009
At the date of observation
Value
Absolute change
Change from the previous value
jan 1, 1996
1.088K
+1.088K
0.0%
jan 1, 1997
2.713K
+1.625K
149.36%
jan 1, 1998
2.333K
-380.0
-14.01%
jan 1, 1999
2.628K
+295.0
12.64%
jan 1, 2000
2.094K
-534.0
-20.32%
jan 1, 2001
2.144K
+50.0
2.39%
jan 1, 2002
4.703K
+2.559K
119.36%
jan 1, 2003
2.536K
-2.167K
-46.08%
jan 1, 2004
2.917K
+381.0
15.02%
jan 1, 2005
3.522K
+605.0
20.74%
jan 1, 2006
4.658K
+1.136K
32.25%
jan 1, 2007
5.139K
+481.0
10.33%
jan 1, 2008
4.775K
-364.0
-7.08%
jan 1, 2009
6.535K
+1.76K
36.86%
jan 1, 2010
4.876K
-1.659K
-25.39%
jan 1, 2011
4.842K
-34.0
-0.7%
jan 1, 2012
5.47K
+628.0
12.97%
jan 1, 2013
5.743K
+273.0
4.99%
jan 1, 2014
6.15K
+407.0
7.09%
jan 1, 2015
5.78K
-370.0
-6.02%
Ranking of countries by current statistics by years