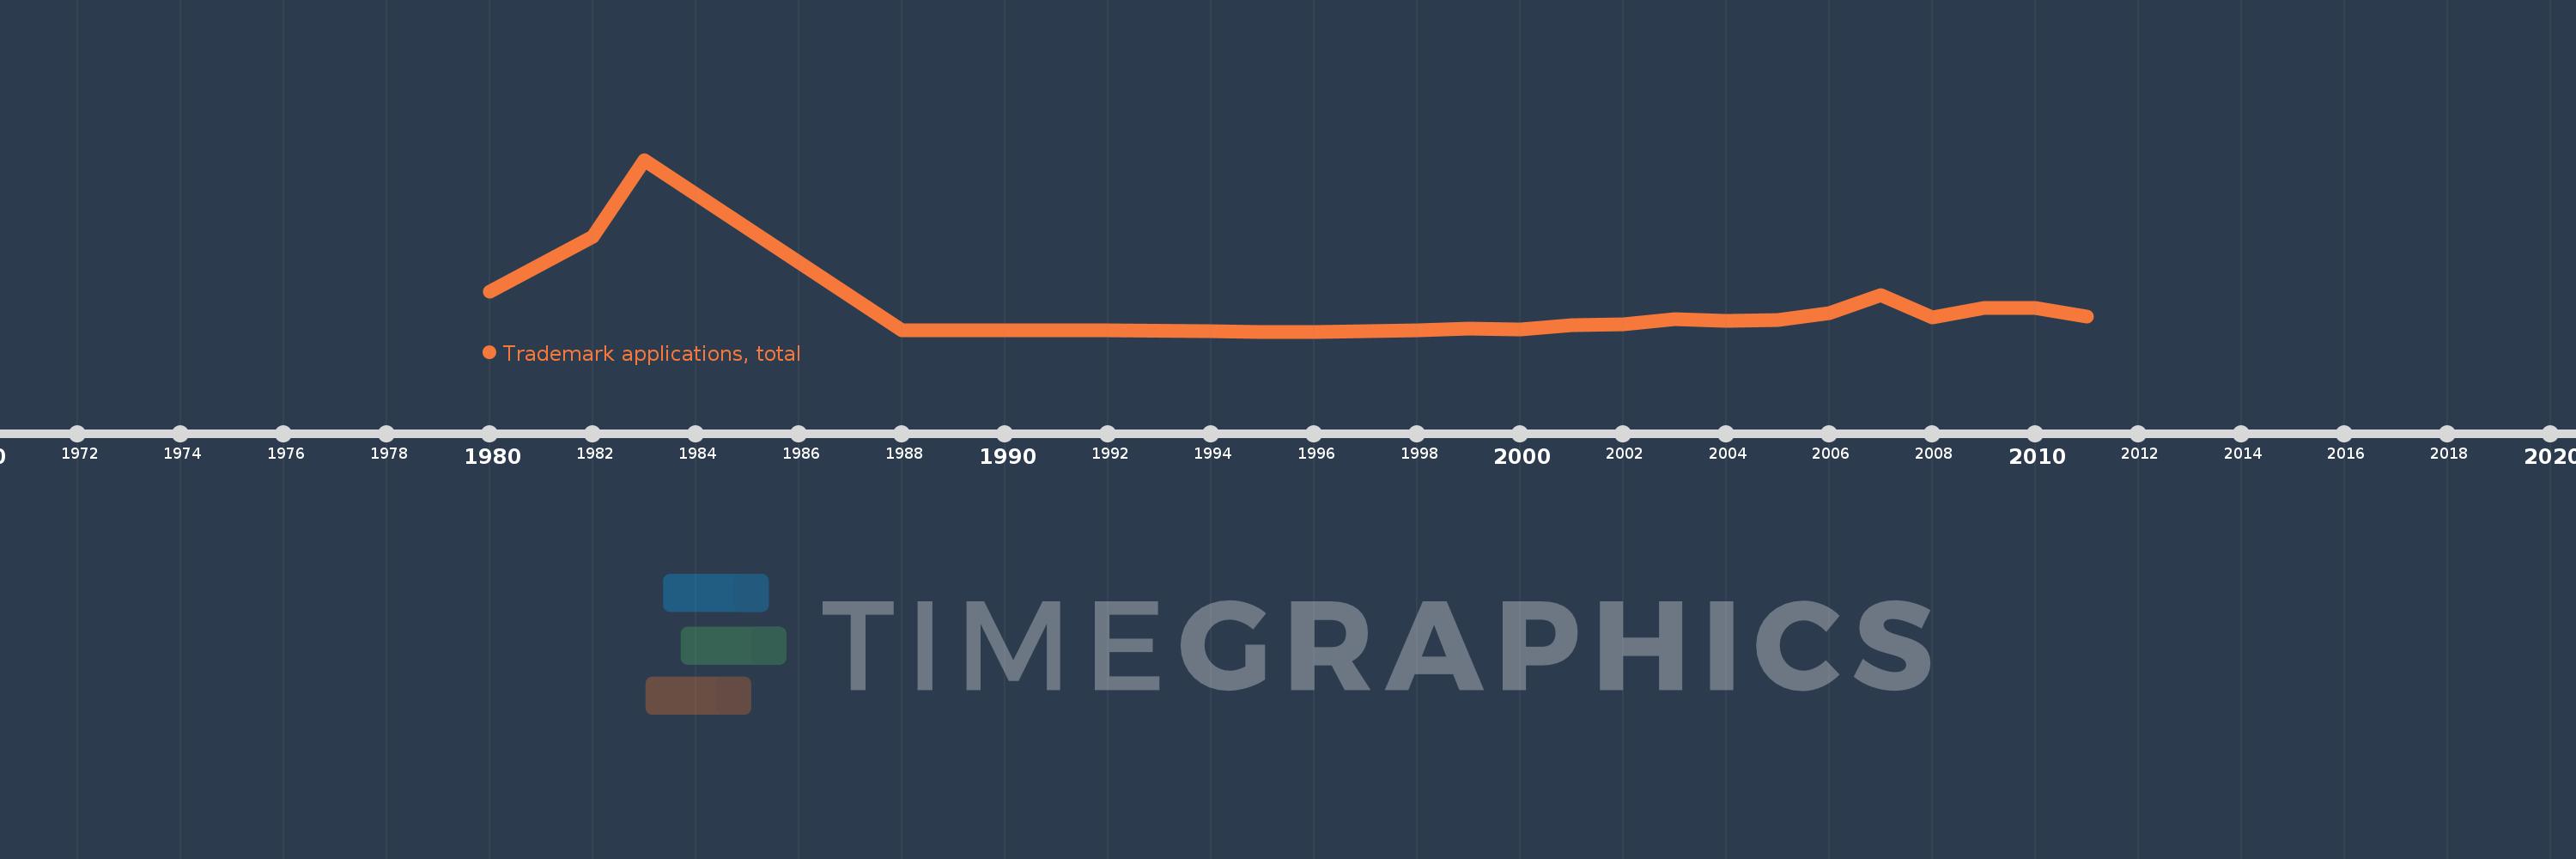
This timeline shows a graph from 1980 to 2011 of Mali. No data until 1979. Number of actual observations by date: 23.
Source name:
World Development Indicators
Source organization:
World Intellectual Property Organization (WIPO), World Intellectual Property Indicators and www.wipo.int/econ_stat. The International Bureau of WIPO assumes no responsibility with respect to the transformation of these data.
Categories, topics:
Science & Technology
Last updated:
apr 23, 2017
Indicators value changes by year
Meaning:
50.217
Minimum:
1.0
jan 1, 1995
Maximum:
394.0
jan 1, 1983
At the date of observation
Value
Absolute change
Change from the previous value
jan 1, 1980
93.0
+93.0
0.0%
jan 1, 1982
218.0
+125.0
134.41%
jan 1, 1983
394.0
+176.0
80.73%
jan 1, 1988
3.0
-391.0
-99.24%
jan 1, 1992
3.0
0.0
0.0%
jan 1, 1994
2.0
-1.0
-33.33%
jan 1, 1995
1.0
-1.0
-50.0%
jan 1, 1996
1.0
0.0
0.0%
jan 1, 1997
2.0
+1.0
100.0%
jan 1, 1998
4.0
+2.0
100.0%
jan 1, 1999
7.0
+3.0
75.0%
jan 1, 2000
5.0
-2.0
-28.57%
jan 1, 2001
16.0
+11.0
220.0%
jan 1, 2002
18.0
+2.0
12.5%
jan 1, 2003
29.0
+11.0
61.11%
jan 1, 2004
25.0
-4.0
-13.79%
jan 1, 2005
28.0
+3.0
12.0%
jan 1, 2006
43.0
+15.0
53.57%
jan 1, 2007
84.0
+41.0
95.35%
jan 1, 2008
33.0
-51.0
-60.71%
jan 1, 2009
55.0
+22.0
66.67%
jan 1, 2010
55.0
0.0
0.0%
jan 1, 2011
36.0
-19.0
-34.55%
Ranking of countries by current statistics by years