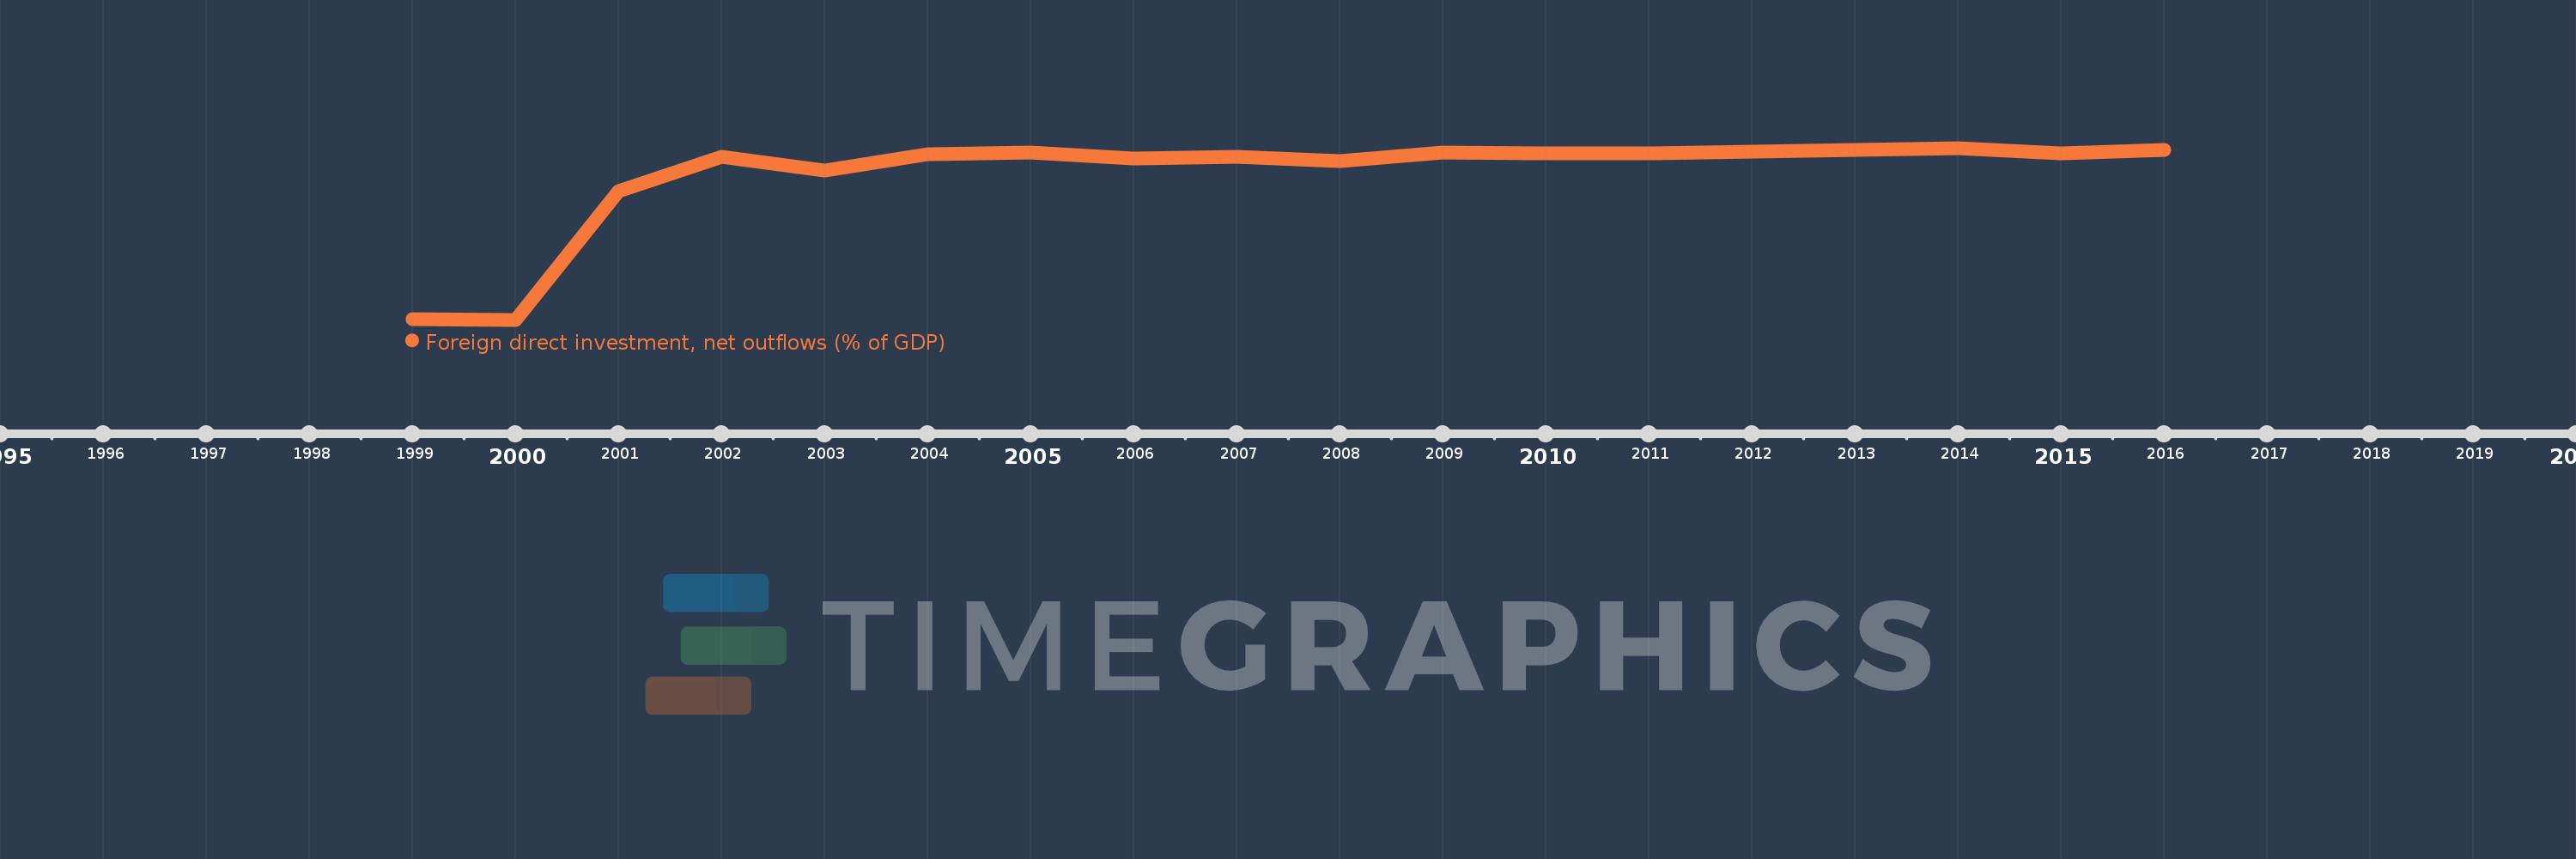
This timeline shows a graph from 1999 to 2016 of Cambodia. No data until 1998. Number of actual observations by date: 18.
Source name:
World Development Indicators
Source organization:
International Monetary Fund, International Financial Statistics and Balance of Payments databases, World Bank, International Debt Statistics, and World Bank and OECD GDP estimates.
Categories, topics:
Economy & Growth, Financial Sector
Last updated:
apr 23, 2017
Indicators value changes by year
Meaning:
-0.292
Minimum:
-3.438
jan 1, 2000
Maximum:
0.299
jan 1, 2014
At the date of observation
Value
Absolute change
Change from the previous value
jan 1, 1999
-3.434
-3.434
0.0%
jan 1, 2000
-3.438
-0.004
0.11%
jan 1, 2001
-0.646
+2.792
-81.21%
jan 1, 2002
0.11
+0.756
-117.01%
jan 1, 2003
-0.19
-0.3
-272.6%
jan 1, 2004
0.156
+0.346
-182.2%
jan 1, 2005
0.192
+0.036
23.11%
jan 1, 2006
0.068
-0.124
-64.57%
jan 1, 2007
0.115
+0.047
69.49%
jan 1, 2008
0.013
-0.103
-89.0%
jan 1, 2009
0.198
+0.185
1.46K%
jan 1, 2010
0.181
-0.016
-8.33%
jan 1, 2011
0.183
+0.002
0.89%
jan 1, 2012
0.227
+0.044
24.18%
jan 1, 2013
0.258
+0.03
13.37%
jan 1, 2014
0.299
+0.042
16.16%
jan 1, 2015
0.19
-0.109
-36.45%
jan 1, 2016
0.263
+0.073
38.21%
Ranking of countries by current statistics by years