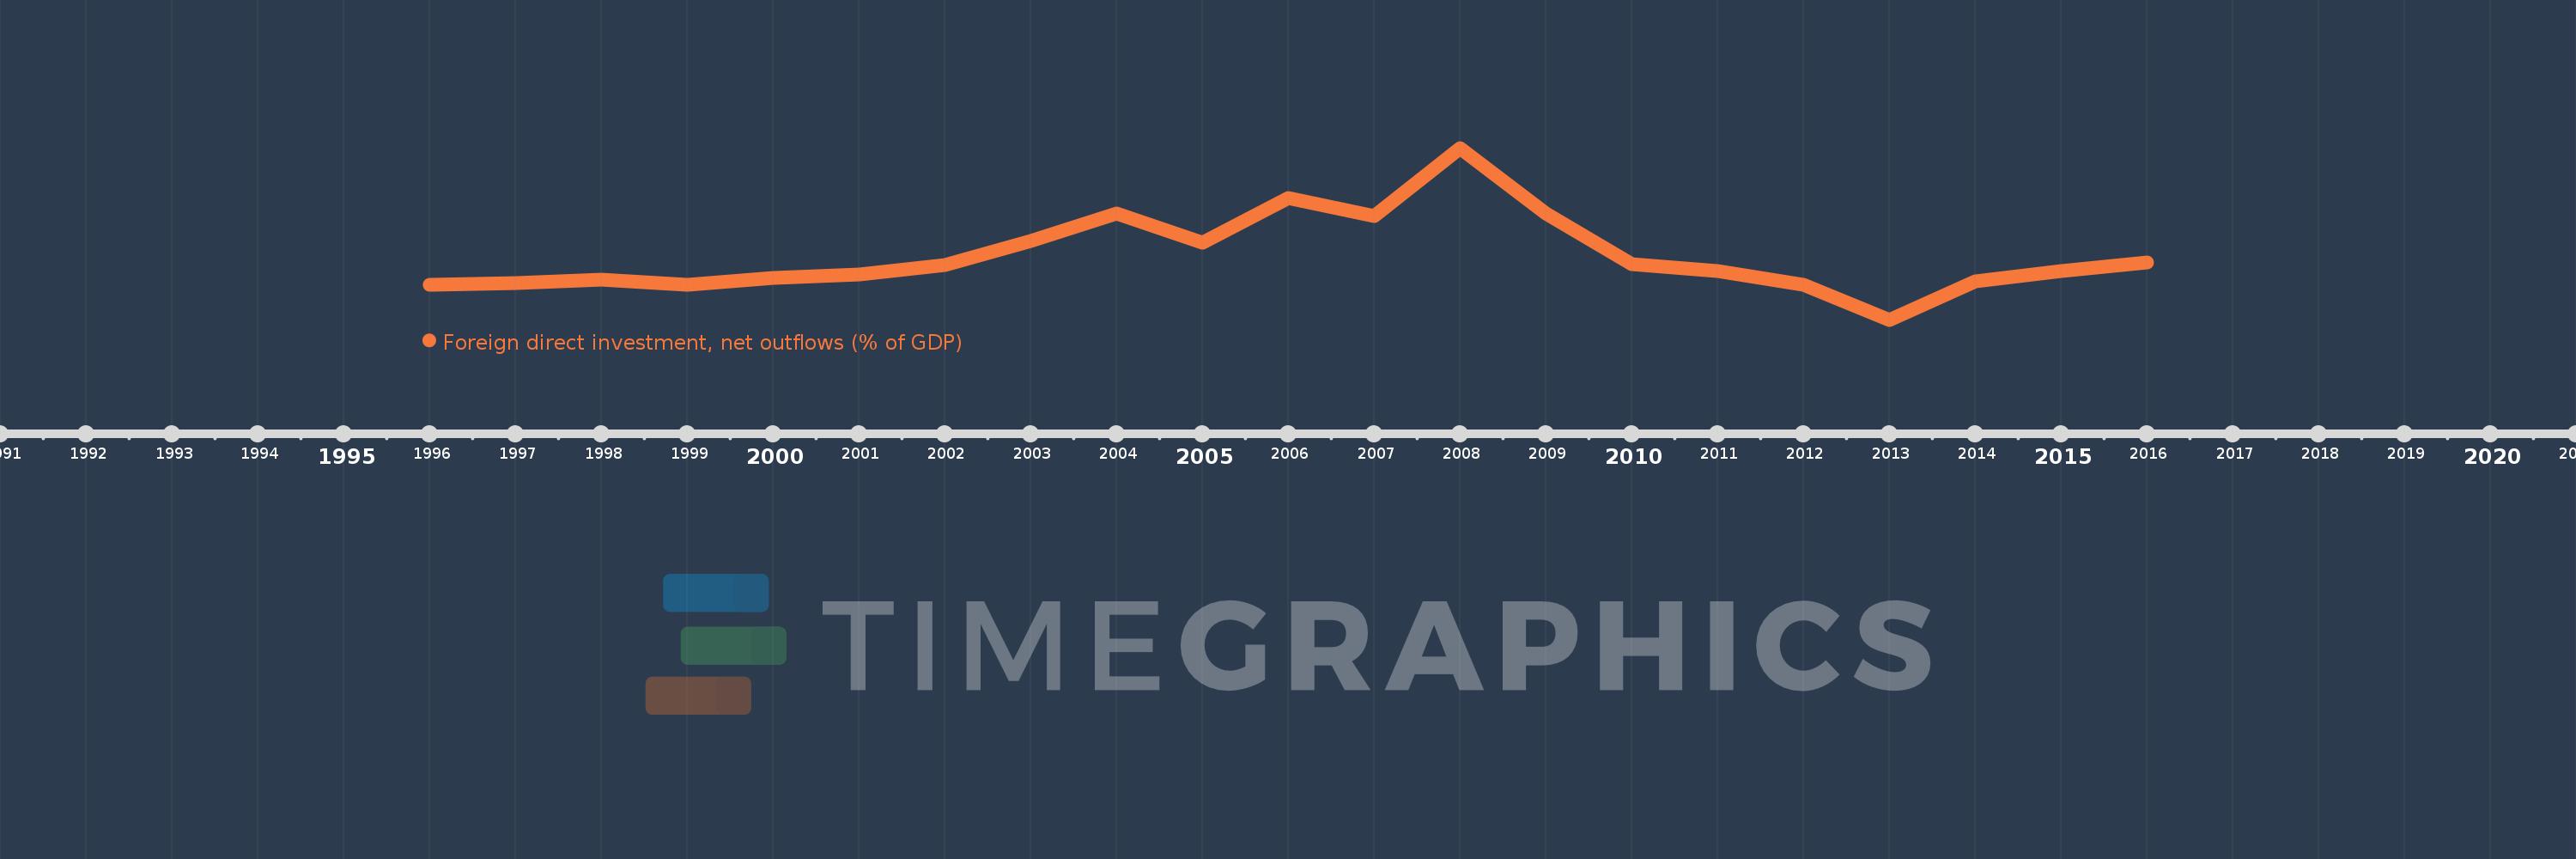
This timeline shows a graph from 1996 to 2016 of Slovenia. No data until 1995. Number of actual observations by date: 21.
Source name:
World Development Indicators
Source organization:
International Monetary Fund, International Financial Statistics and Balance of Payments databases, World Bank, International Debt Statistics, and World Bank and OECD GDP estimates.
Categories, topics:
Economy & Growth, Financial Sector
Last updated:
apr 23, 2017
Indicators value changes by year
Meaning:
0.941
Minimum:
-1.224
jan 1, 2013
Maximum:
4.606
jan 1, 2008
At the date of observation
Value
Absolute change
Change from the previous value
jan 1, 1996
-0.047
-0.047
0.0%
jan 1, 1997
0.034
+0.081
-171.31%
jan 1, 1998
0.149
+0.115
344.28%
jan 1, 1999
-0.025
-0.174
-116.69%
jan 1, 2000
0.21
+0.235
-945.69%
jan 1, 2001
0.321
+0.111
52.7%
jan 1, 2002
0.625
+0.304
94.74%
jan 1, 2003
1.449
+0.824
131.83%
jan 1, 2004
2.39
+0.941
64.94%
jan 1, 2005
1.397
-0.993
-41.55%
jan 1, 2006
2.914
+1.517
108.6%
jan 1, 2007
2.289
-0.626
-21.47%
jan 1, 2008
4.606
+2.317
101.24%
jan 1, 2009
2.396
-2.21
-47.99%
jan 1, 2010
0.676
-1.72
-71.79%
jan 1, 2011
0.416
-0.26
-38.43%
jan 1, 2012
-0.028
-0.444
-106.61%
jan 1, 2013
-1.224
-1.197
4.35K%
jan 1, 2014
0.067
+1.291
-105.48%
jan 1, 2015
0.429
+0.362
539.6%
jan 1, 2016
0.725
+0.296
68.93%
Ranking of countries by current statistics by years