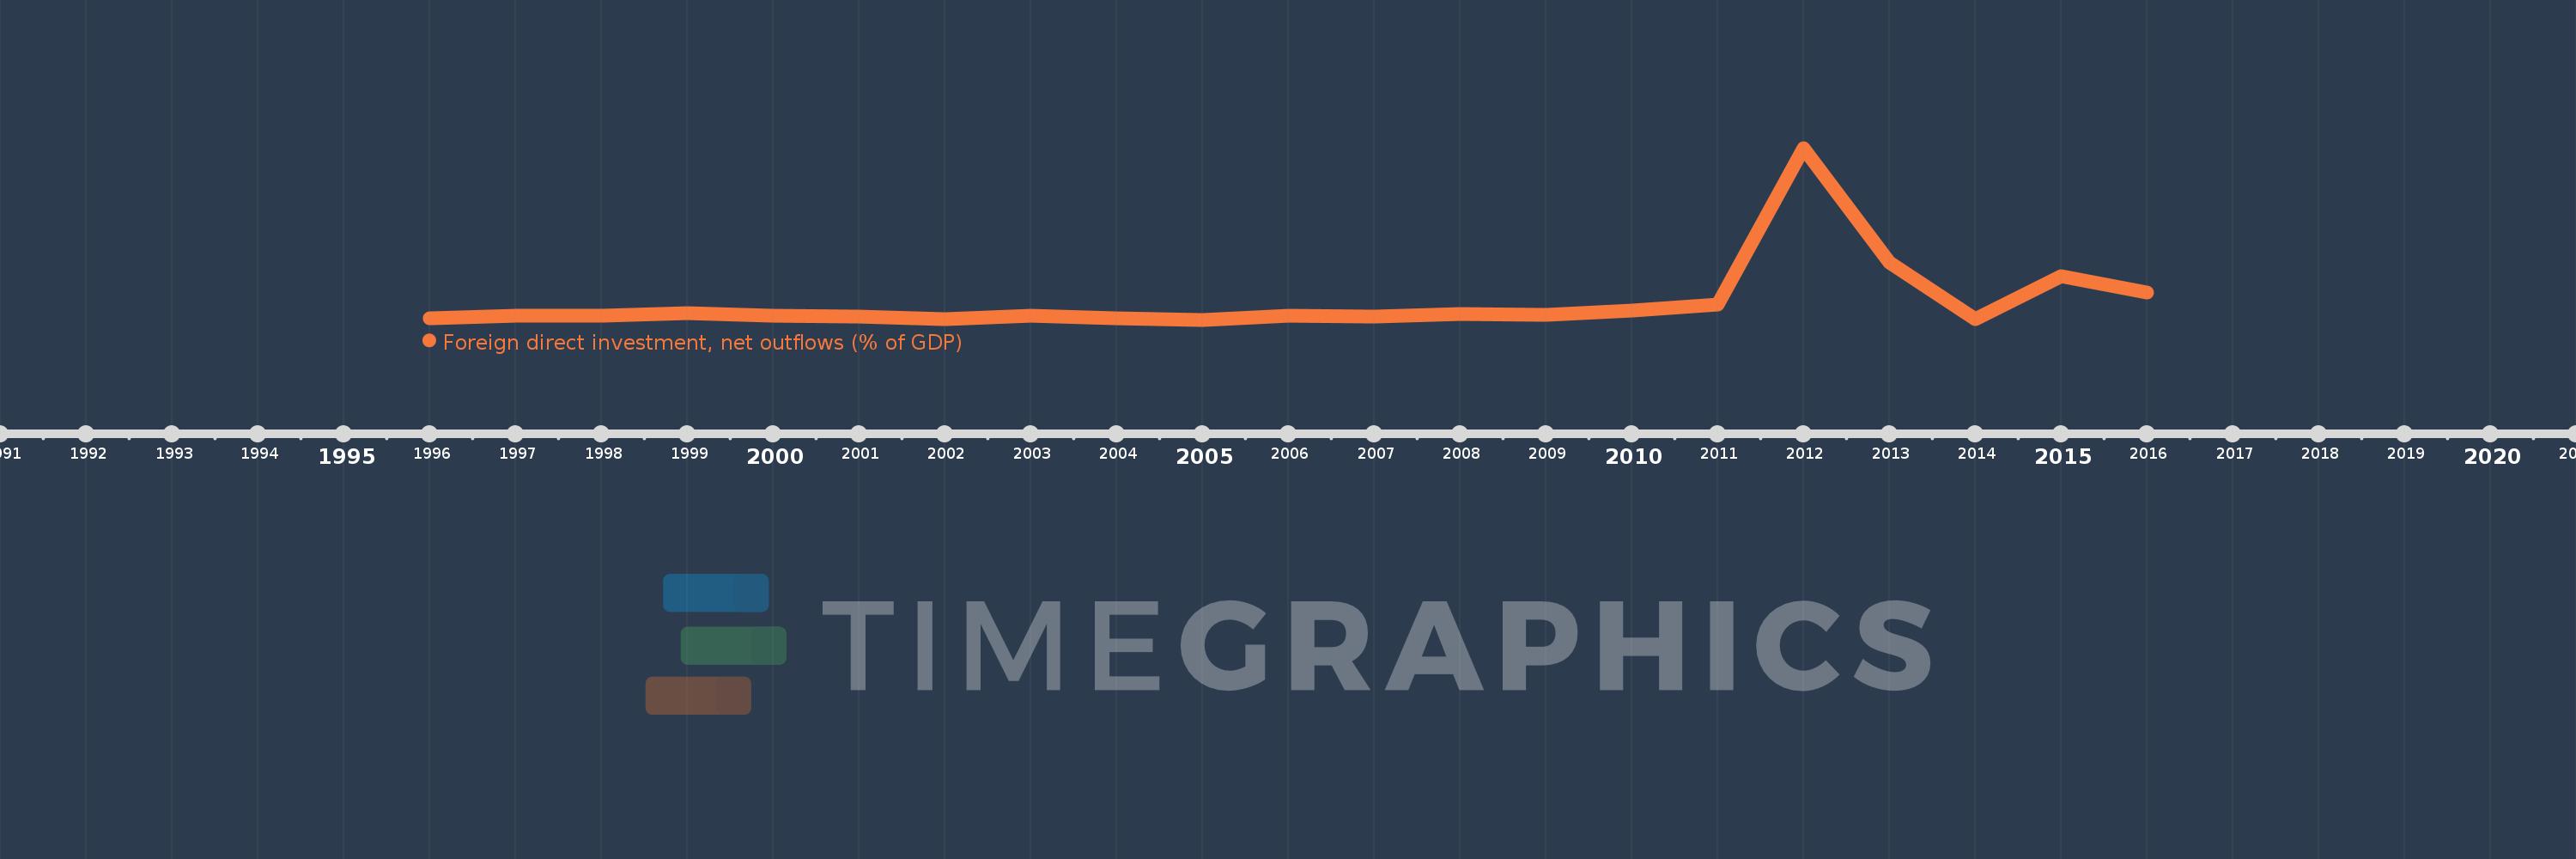
This timeline shows a graph from 1996 to 2016 of Togo. No data until 1995. Number of actual observations by date: 21.
Source name:
World Development Indicators
Source organization:
International Monetary Fund, International Financial Statistics and Balance of Payments databases, World Bank, International Debt Statistics, and World Bank and OECD GDP estimates.
Categories, topics:
Economy & Growth, Financial Sector
Last updated:
apr 23, 2017
Indicators value changes by year
Meaning:
2.895
Minimum:
-0.649
jan 1, 2005
Maximum:
33.667
jan 1, 2012
At the date of observation
Value
Absolute change
Change from the previous value
jan 1, 1996
-0.443
-0.443
0.0%
jan 1, 1997
0.19
+0.633
-142.9%
jan 1, 1998
0.163
-0.027
-13.96%
jan 1, 1999
0.667
+0.504
308.33%
jan 1, 2000
0.183
-0.484
-72.56%
jan 1, 2001
0.035
-0.148
-81.04%
jan 1, 2002
-0.544
-0.579
-1.67K%
jan 1, 2003
0.16
+0.705
-129.48%
jan 1, 2004
-0.379
-0.539
-335.92%
jan 1, 2005
-0.649
-0.271
71.53%
jan 1, 2006
0.194
+0.843
-129.87%
jan 1, 2007
-0.019
-0.213
-109.89%
jan 1, 2008
0.494
+0.513
-2.67K%
jan 1, 2009
0.343
-0.15
-30.42%
jan 1, 2010
1.107
+0.763
222.18%
jan 1, 2011
2.405
+1.298
117.29%
jan 1, 2012
33.667
+31.263
1.3K%
jan 1, 2013
10.871
-22.796
-67.71%
jan 1, 2014
-0.507
-11.377
-104.66%
jan 1, 2015
7.997
+8.504
-1.68K%
jan 1, 2016
4.853
-3.144
-39.31%
Ranking of countries by current statistics by years