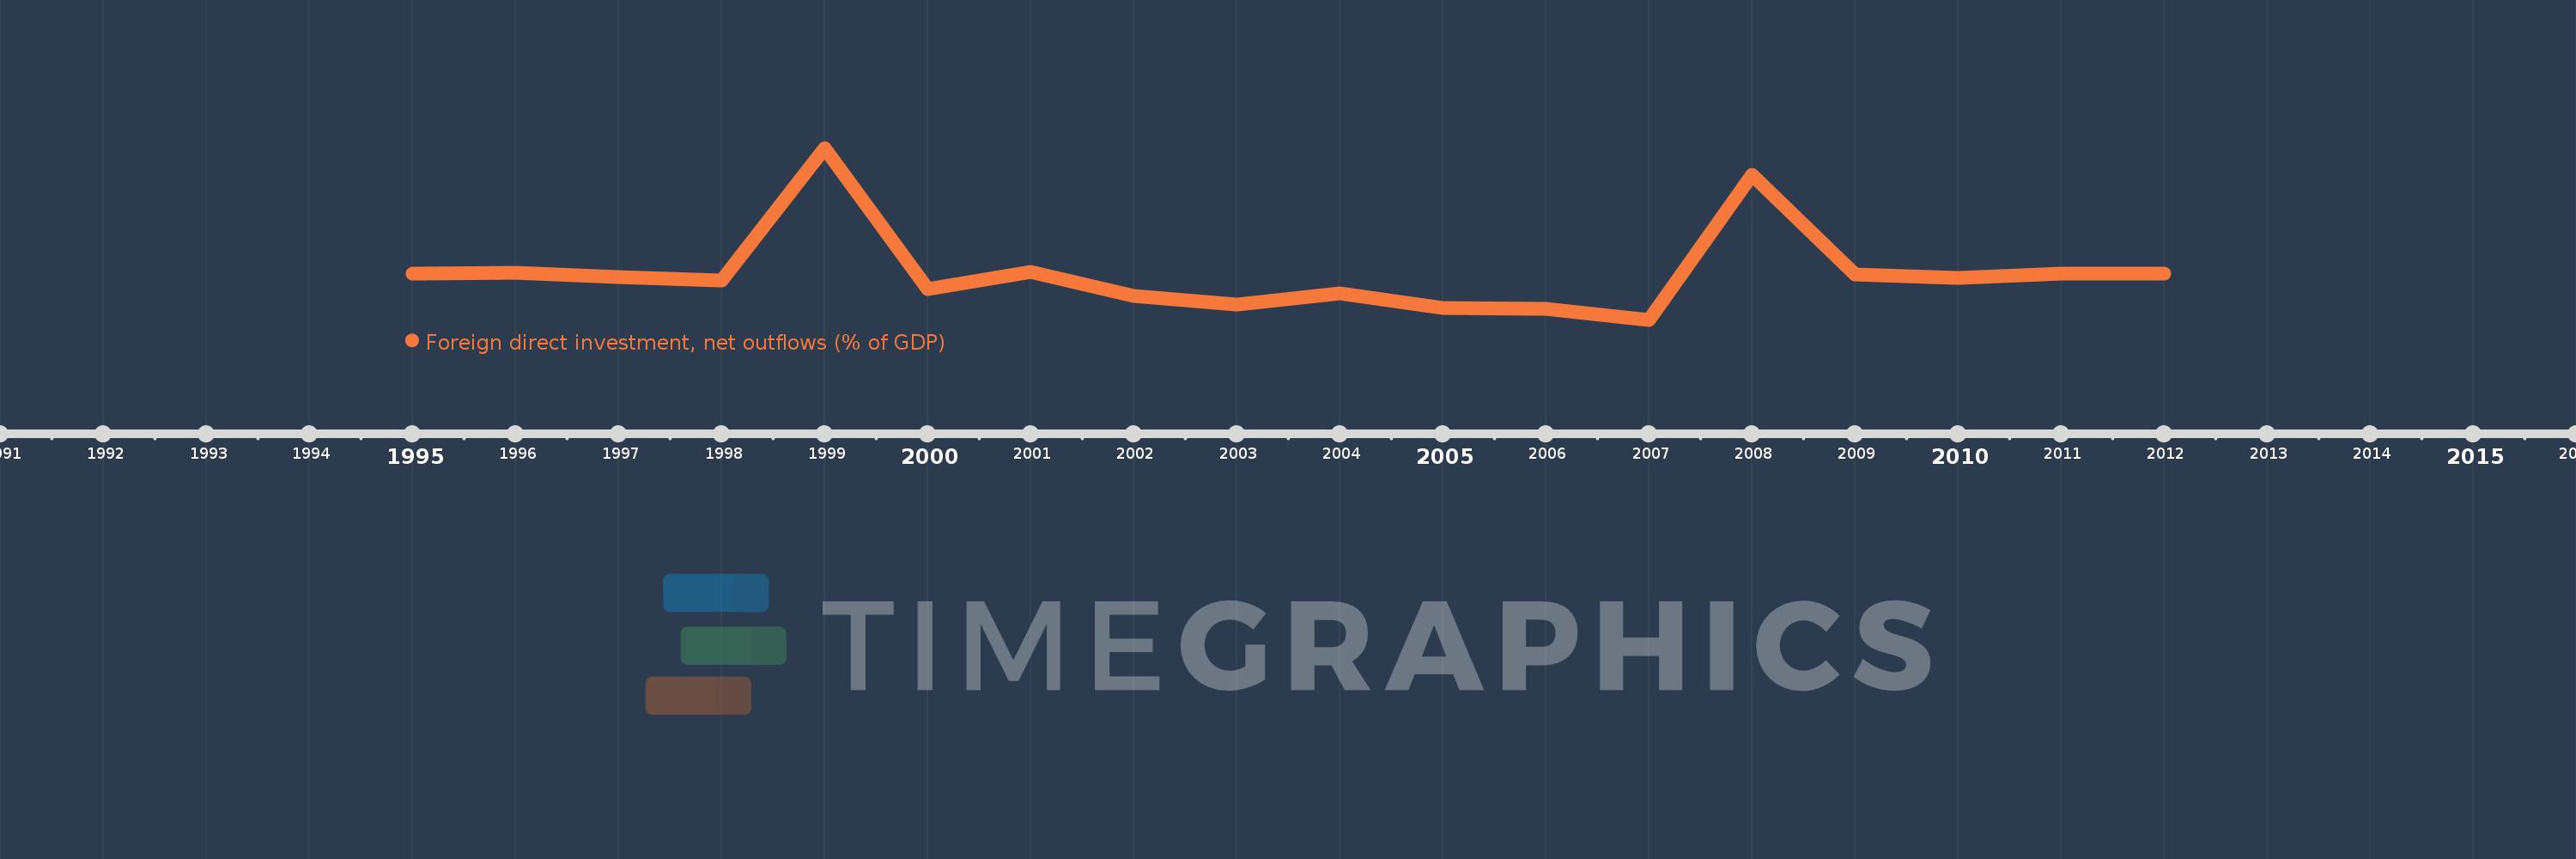
This timeline shows a graph from 1995 to 2012 of Aruba. No data until 1994. Number of actual observations by date: 18.
Source name:
World Development Indicators
Source organization:
International Monetary Fund, International Financial Statistics and Balance of Payments databases, World Bank, International Debt Statistics, and World Bank and OECD GDP estimates.
Categories, topics:
Economy & Growth, Financial Sector
Last updated:
apr 23, 2017
Indicators value changes by year
Meaning:
0.122
Minimum:
-0.53
jan 1, 2007
Maximum:
1.879
jan 1, 1999
At the date of observation
Value
Absolute change
Change from the previous value
jan 1, 1995
0.113
+0.113
0.0%
jan 1, 1996
0.127
+0.014
11.91%
jan 1, 1997
0.065
-0.062
-48.96%
jan 1, 1998
0.015
-0.05
-77.48%
jan 1, 1999
1.879
+1.864
12.78K%
jan 1, 2000
-0.104
-1.982
-105.52%
jan 1, 2001
0.14
+0.244
-235.06%
jan 1, 2002
-0.192
-0.332
-237.0%
jan 1, 2003
-0.317
-0.125
64.88%
jan 1, 2004
-0.16
+0.156
-49.36%
jan 1, 2005
-0.366
-0.206
128.34%
jan 1, 2006
-0.38
-0.014
3.88%
jan 1, 2007
-0.53
-0.149
39.26%
jan 1, 2008
1.508
+2.037
-384.68%
jan 1, 2009
0.1
-1.407
-93.36%
jan 1, 2010
0.06
-0.04
-39.67%
jan 1, 2011
0.111
+0.051
83.78%
jan 1, 2012
0.121
+0.01
9.12%
Ranking of countries by current statistics by years